PROFINET Communication Loss: How to Diagnose It
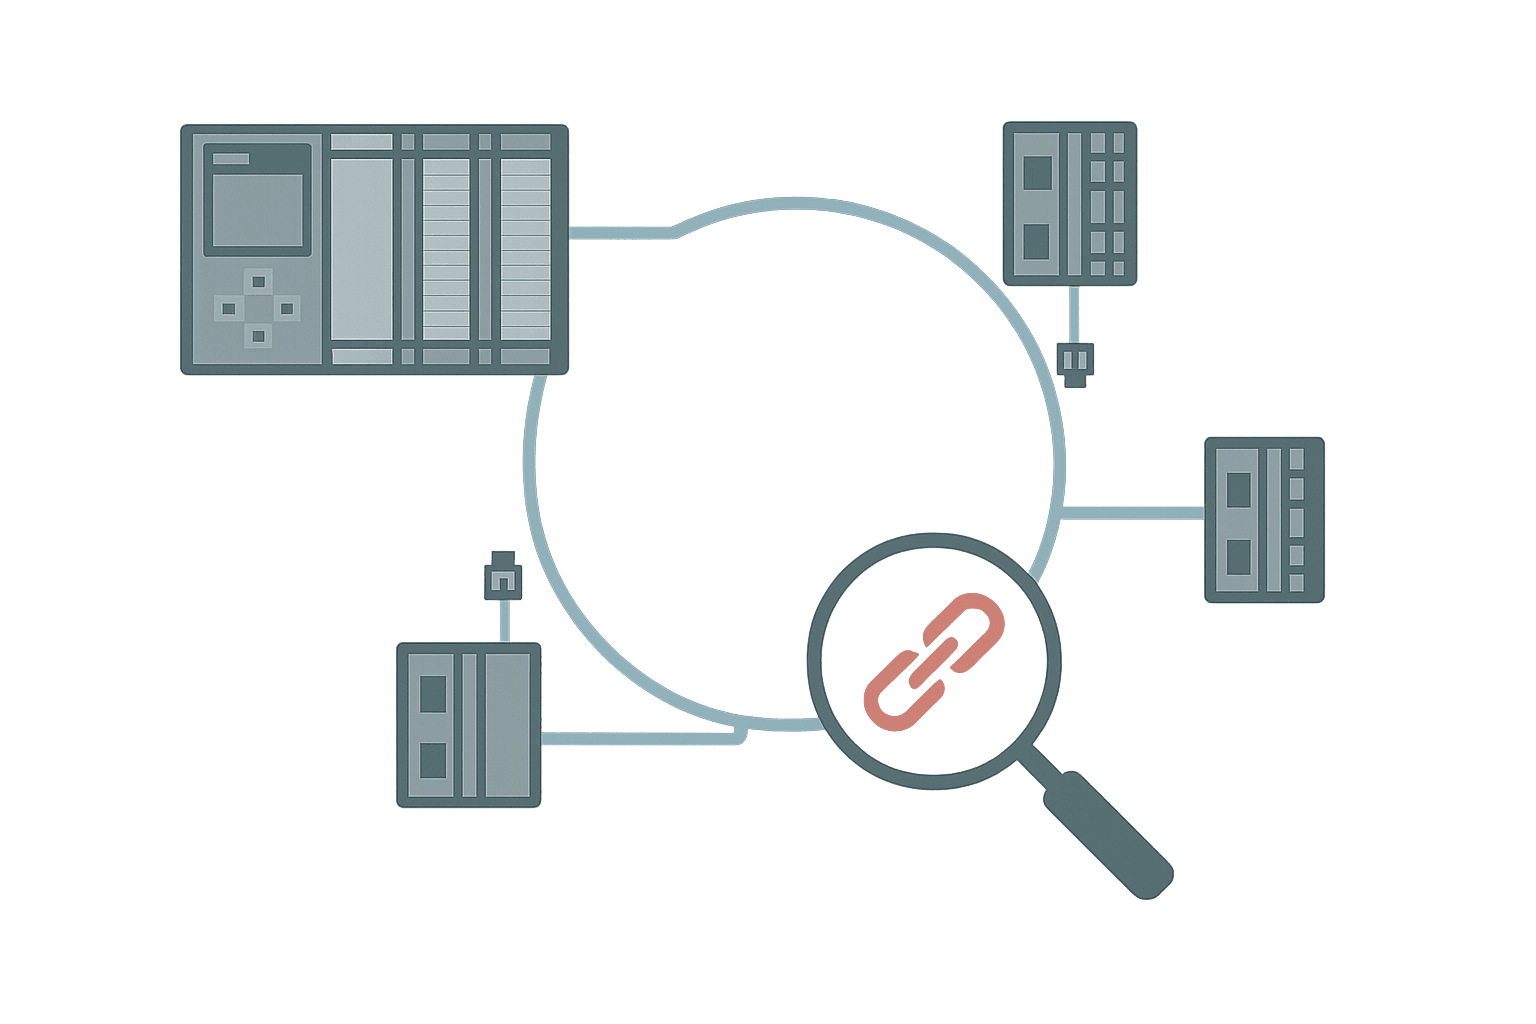
Your S7-1500 throws a PROFINET station failure alarm at 2 AM and a conveyor line stops. The on-call tech resets the CPU and it comes back. Two nights later, same thing. That pattern, intermittent PROFINET communication loss with no obvious cause, is one of the most frustrating faults in modern automation. This post gives you a repeatable diagnosis process so the next time it happens you find the actual root cause instead of just rebooting and hoping.
Why PROFINET Communication Loss Is Easy to Misdiagnose
PROFINET is unforgiving about timing. The default IO cycle for most S7-1500 projects is 1 ms to 4 ms, and the watchdog multiplier is typically 3 to 6 cycles. That means the PLC declares a station failed after just 3 ms to 24 ms of silence. A single corrupted frame caused by a loose RJ45, a failing managed switch, or a burst of EMI is enough to trigger that watchdog. The CPU goes to STOP or raises a hardware fault OB, and you get a tidy alarm that says 'Station failure: ET 200SP, slot 3' but tells you nothing about why the frames stopped.
People reach for the obvious fixes first: power-cycle the device, swap the cable, replace the IO module. Sometimes that works. More often it masks the underlying cause and the fault returns in a week. The right approach is to treat it like any other diagnostic: gather data, isolate the layer, confirm the fix.
Step 1: Read the Diagnostic Buffer Before You Touch Anything
In TIA Portal, open the CPU online view and go to Diagnostics > Diagnostic Buffer. The buffer stores the last 512 events with timestamps to the millisecond. Look for three things:
- The exact timestamp of the first station failure event. Note whether it correlates with a shift change, a large motor starting, or a scheduled task.
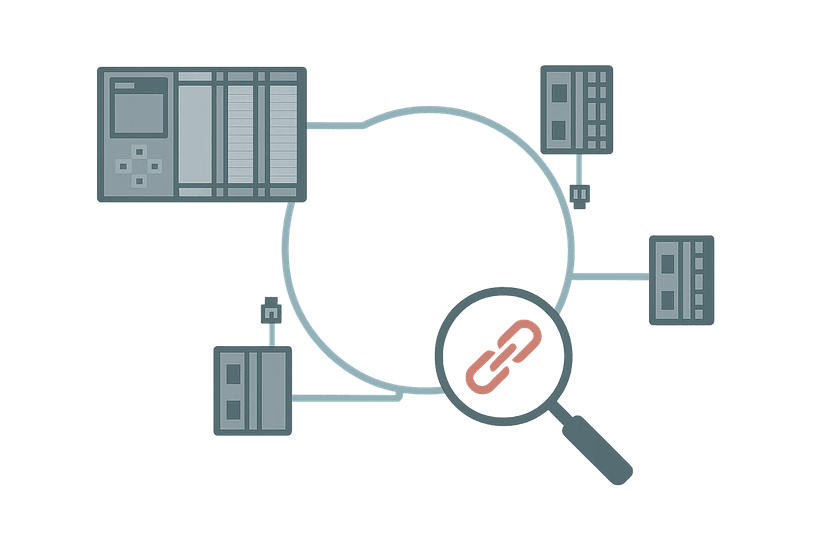
- Whether the failure is for one specific device or multiple devices simultaneously. One device failing alone points to that device or its link. Multiple devices failing at the same second points to a switch, a ring break, or a shared power rail.
- Any preceding events: port state changes, firmware faults, redundancy switchovers. These often appear 50 ms to 200 ms before the station failure alarm and are the real clue.
Step 2: Check Device and Port Status in the Topology View
TIA Portal's Network View > Topology tab shows the live port state of every PROFINET device, provided you have the device connected and online. Right-click any device and open Device Diagnostics. The port status table will show you which physical port is connected, the negotiated speed (100 Mbit/s full-duplex is mandatory for PROFINET), and any port errors.
Pay attention to the error counters on each port. A high count of CRC errors (anything above a handful per hour) on one specific port almost always means a bad cable or a poorly crimped RJ45 on that segment. Alignment errors point to duplex mismatch, which should not happen with auto-negotiation but does if someone hard-coded one side to half-duplex.
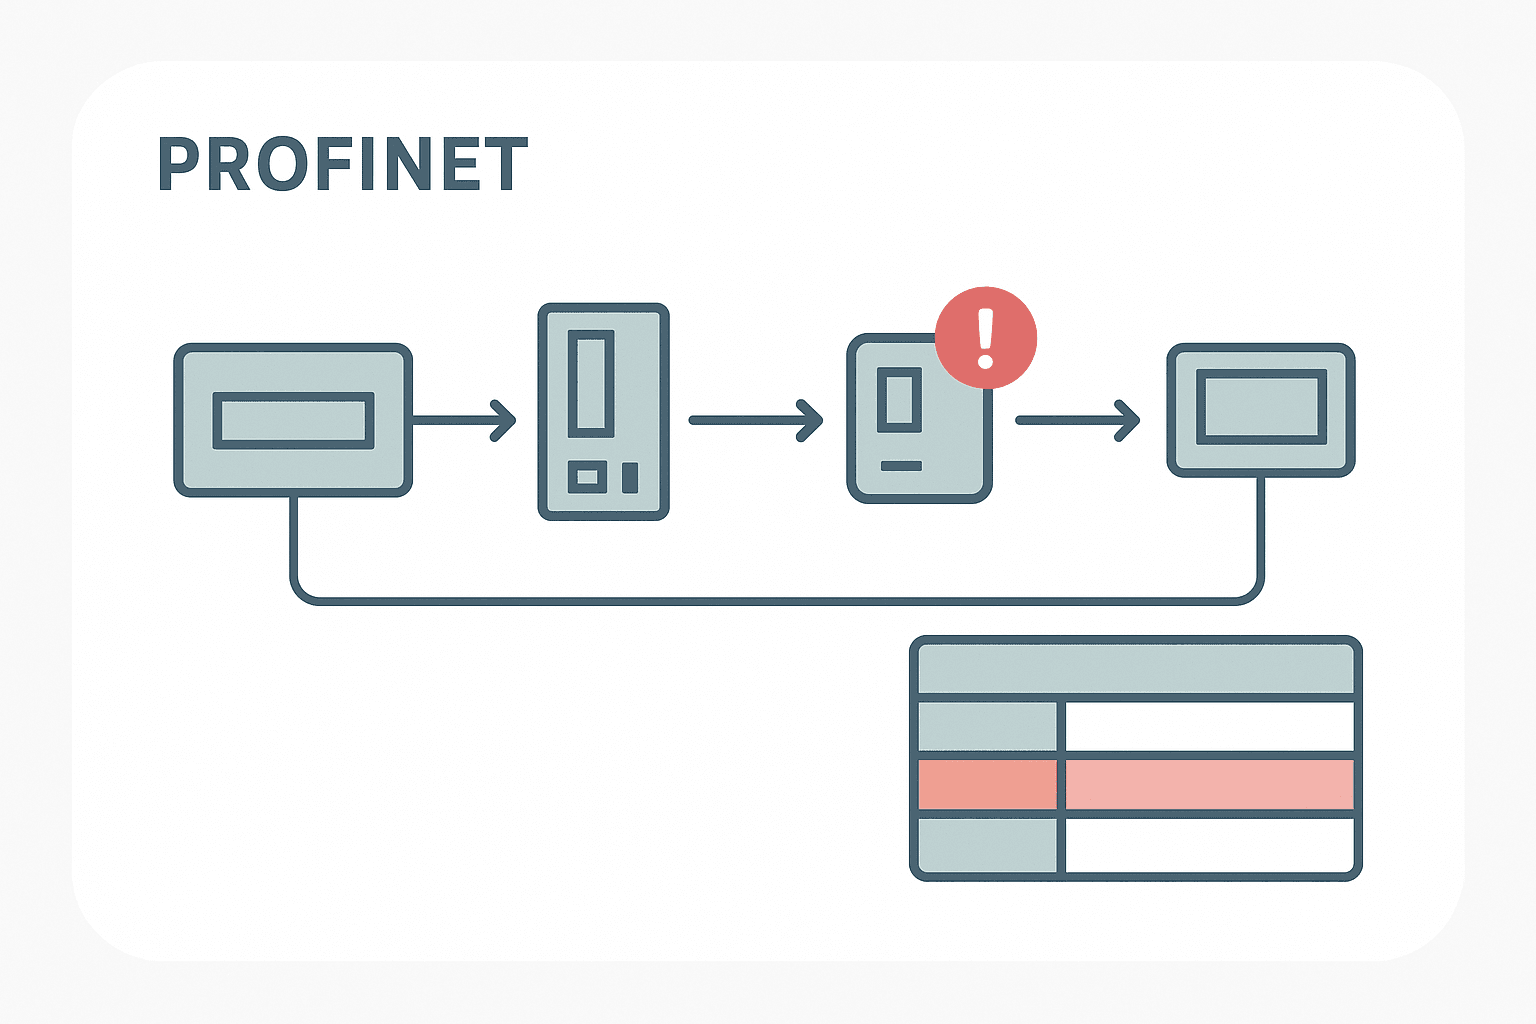
Step 3: Ping and Wireshark to Confirm the Network Layer
A simple ping from a laptop tells you whether the device is reachable at the IP layer. PROFINET devices always respond to ICMP ping even when the IO cycle is failing, so a ping failure means the device is fully offline, not just experiencing frame loss. If ping succeeds but the PLC still shows a station failure, the problem is at the PROFINET RT layer, not the IP layer, and you need a packet capture.
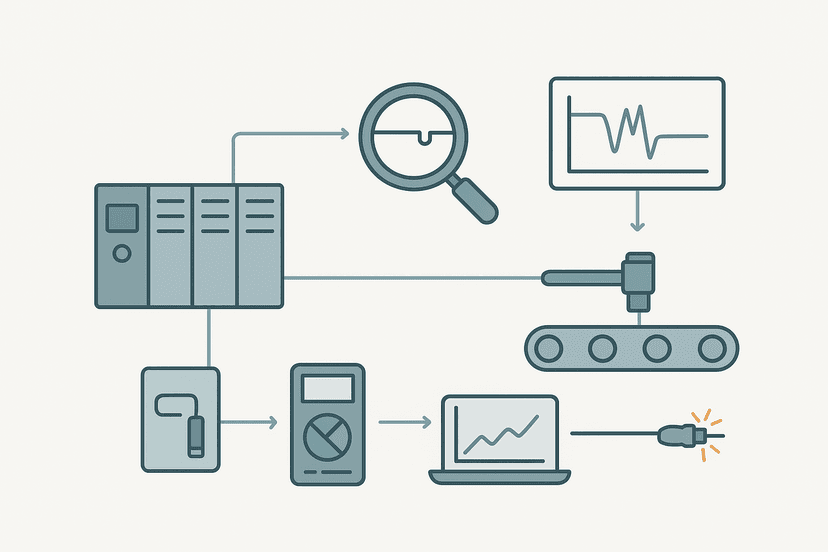
Connect a laptop with Wireshark to a mirror port on the switch closest to the suspect device. Capture for 10 to 15 minutes. Filter on pn_io in Wireshark. You are looking for:
- Gaps in the cyclic data frames. If you see the IO cycle running at 4 ms intervals and then a gap of 20 ms or more, that is your watchdog trigger.
- Bad frame checksums. Wireshark marks these in red. Even one bad frame per minute can be enough to trigger a watchdog on a short cycle.
- Alarm frames from the device. ET 200SP and similar devices send PROFINET alarm frames before they drop off. These will tell you the internal fault code.
- Duplicate IP or MAC conflicts. If two devices share an IP, you will see ARP conflicts in the capture.
Step 4: Test the Physical Layer Properly
Most PROFINET faults I have traced over the years come down to the physical layer. The network logic is fine; the cable is the problem. A continuity tester is not enough here. You need a cable tester that checks all four pairs for length, impedance, crosstalk and return loss, or at minimum a tester that does a Time Domain Reflectometry (TDR) scan. The Fluke DSX CableAnalyzer is the gold standard. A Softing PROFItest or similar PROFINET-specific tester will also catch PROFINET-specific issues like channel attenuation.
Things to physically check in order of how often they actually cause intermittent faults:
- RJ45 connectors crimped in the field. Industrial PROFINET uses Cat 5e minimum, but the bigger problem is cold crimps where one or two pins make intermittent contact. Pull-test every field-crimped connector with 5 kg of force.
- Cable routed through a cable chain (energy chain / drag chain). Every flex cycle works the conductors at the connector entry point. Inspect the first and last 10 cm of any cable exiting a drag chain.
- Cables routed near high-voltage conductors or VFD output cables. PROFINET is not immune to induced noise. Siemens recommends at least 200 mm separation from VFD cables and crossings at 90 degrees.
- Switches inside enclosures that are thermally stressed. An unmanaged switch running at 70 C ambient will drop packets. Feel the switch housing. If it is too hot to keep your hand on it, add ventilation.
- Fiber segments with dirty connectors. One contaminated LC connector face causes 3 dB to 6 dB of loss, which is enough to drop the link sporadically.
Step 5: Check the Switch Configuration for PROFINET Compliance
Not every managed switch is suitable for PROFINET. The main requirements are: no Spanning Tree Protocol (STP or RSTP) on ports carrying PROFINET IO devices (STP can block a port for 30 seconds during topology changes, which is fatal), LLDP enabled so the topology view works, and no IGMP snooping on the PROFINET VLAN. Many IT-managed switches have STP enabled by default and nobody disables it when the switch goes into the panel.
If you are using Media Redundancy Protocol (MRP) for ring topology, the MRP manager must be set correctly in TIA Portal and on the switch. A misconfigured MRP role causes the ring to break and reform constantly, which looks exactly like random station failures. Check that exactly one device in the ring is set as MRP Manager and all others are MRP Clients.
| Switch Setting | Correct for PROFINET | Common Wrong Value |
|---|---|---|
| Spanning Tree (STP/RSTP) on IO ports | Disabled | Enabled (IT default) |
| Port speed and duplex | Auto-negotiate or 100 Mbit/s full-duplex | Hard-coded half-duplex |
| LLDP | Enabled | Disabled |
| IGMP snooping on PROFINET VLAN | Disabled | Enabled |
| MRP role (ring topology) | Exactly one Manager, rest Clients | Multiple Managers or none set |
| Port mirroring for capture | On a dedicated monitor port only | On a live IO port (causes latency) |
Step 6: Use the PLC Program to Detect and Log Future Failures
Once you have fixed the immediate fault, add logic to detect and timestamp future PROFINET losses automatically. In S7-1500 you can read device status using the DeviceStates system function or by monitoring the LADDR status bits. In Rockwell Logix you would use the MSG instruction status bits. A simple approach in any PLC is to monitor the communication fault tag that the IO scanner automatically sets when a device goes offline, latch the fault with a timestamp, and log it to a data block or HMI alarm.
The ladder rung below shows a generic approach: detect the rising edge of a PROFINET station fault bit, capture the system clock into a log structure, and increment an occurrence counter. This gives you a history of every dropout without relying on someone to export the diagnostic buffer manually.
PROFINET Station Fault Logging with Timestamp and Counter (S7-1500 style, generic tags). Ladder logic (3 rungs): Rung 0: examine if ET200SP_Slot3_CommFault is on (XIC), then examine if ET200SP_Slot3_FaultRise is on (XIC), then either CTU on PN_FaultLog.OccurrenceCount. Rung 1: examine if ET200SP_Slot3_FaultRise is on (XIC), then latch output PN_FaultLog.FaultActive (OTL). Rung 2: examine if PN_FaultLog.FaultActive is on (XIC), then examine if HMI_FaultAck is on (XIC), then examine if ET200SP_Slot3_CommFault is on (XIC), then unlatch output PN_FaultLog.FaultActive (OTU). Rung 1: Rising edge of the station comm fault bit increments a persistent occurrence counter. Rung 2: Latches a fault-active flag on any new fault rising edge. Rung 3: Unlatch only when the operator acknowledges AND the comm fault has actually cleared, preventing false resets while the link is still down.
The diagram above evaluates one scan. Run these exact rungs on a real scan cycle to watch the latching and the timers behave.
Run this in the simulatorThe Fastest Field Triage: A 5-Minute Checklist
When you are standing in front of a stopped line and need to get it running while you plan the proper fix, run through this in order:
- Check the link LEDs on the affected device and on the switch port it connects to. Both should be solid green. Flashing or off means a physical layer issue.
- Wiggle every RJ45 on the suspect segment while watching the link LED. If it flickers, you found it.
- Check the device's own diagnostic LEDs. An ET 200SP BusF LED (red) means the device is seeing the network problem too, not just the PLC.
- Swap the patch cable between the device and the switch with a known-good factory-made cable. Do not swap with another field-crimped cable.
- If the device has dual ports and is in a ring, check that the ring is healthy and no other node is also showing a fault.
PROFINET Communication Loss Diagnosis: Putting It Together
The pattern I see on most sites is: fault happens, someone reboots, it goes away for two weeks, then it is back. The fix is always the same three things: read the diagnostic buffer before touching anything, check the physical layer with a real cable tester, and verify the switch configuration against the PROFINET requirements. Skip any of those and you are guessing.
If you have done all of the above and the fault still recurs, the next step is to log the fault timestamps against your site's energy meter data, VFD run commands, and production schedule. I have seen PROFINET faults that only occurred when a 75 kW compressor started, because the cable run shared a trunking with the motor starter cable and the induced transient was just enough to corrupt a frame. You will not find that without the correlation data.
Frequently asked questions
What causes PROFINET communication loss on an S7-1500?
How do I find which device is causing a PROFINET failure?
Can STP (Spanning Tree Protocol) cause PROFINET station failures?
How do I use Wireshark to diagnose PROFINET communication loss?
What cable tester do I need for PROFINET troubleshooting?
Why does my PROFINET fault only happen intermittently and clear on its own?
Learn this by building it
There is a PLC in this site. It runs a real scan engine, checks your logic against the same tests a working machine would fail, and needs no download and no account.
Open the exercisesFree, no signup, runs in your browser. See all 16 exercises.
Was this helpful?