PLC Scan Cycle Problems: Logic and Timing Faults
A machine stops unexpectedly, a valve fires at the wrong moment, or a counter misses counts during a burst of parts. You check the wiring, the sensor, the output card. Everything looks fine. The real culprit is often sitting invisibly in the PLC scan cycle itself. Scan-related timing faults are genuinely common, and they are some of the hardest to catch because the program looks correct when you read it offline.
This post is specifically about diagnosing and fixing faults caused by PLC scan cycle behaviour: watchdog trips, missed single-scan pulses, race conditions between rungs, and output glitches from long scan times. Not hardware I/O failures. Not comms loss. The scan cycle itself.
What the Scan Cycle Actually Does to Your Logic
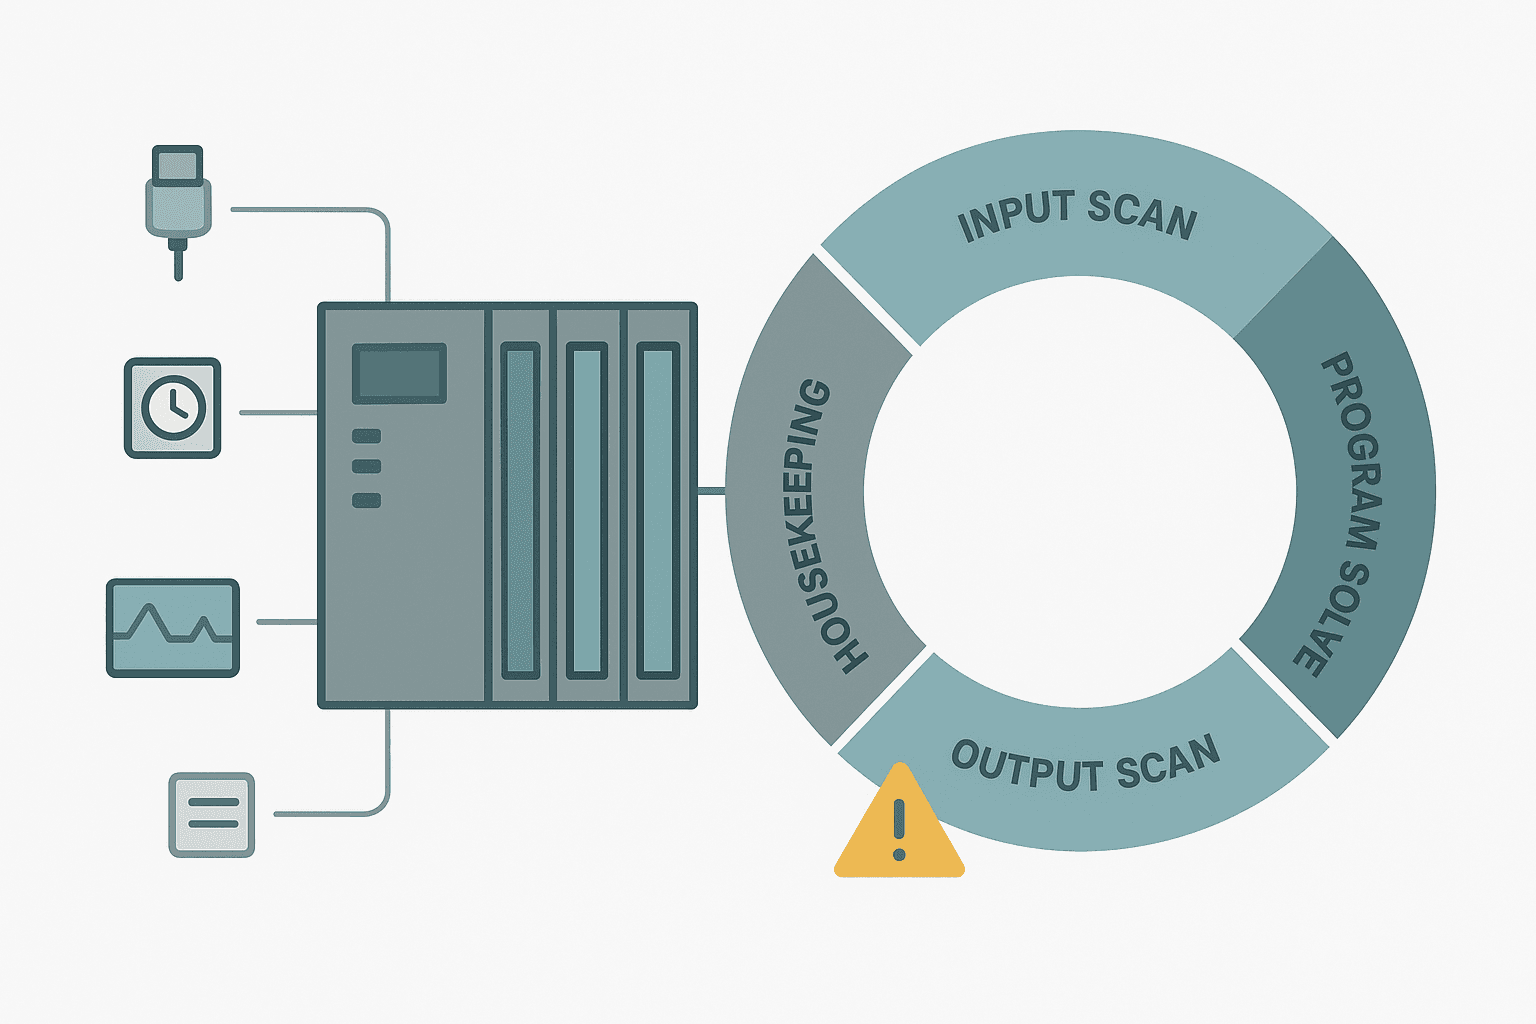
Every PLC executes the same loop, over and over: read all physical inputs into an input image table, execute every rung of logic top to bottom, write the output image table to the physical outputs, do housekeeping (comms, self-diagnostics), then repeat. The time for one complete loop is the scan time.
Typical scan times sit between 1 ms and 30 ms depending on the CPU, the program size and how many comms tasks are running. A Siemens S7-1200 running a modest OB1 program might scan in 3 to 5 ms. A CompactLogix with 10,000 rungs of ladder and several motion tasks might be 15 to 25 ms. That gap matters enormously when you are trying to detect a 5 ms input pulse.
PLC Scan Cycle Troubleshooting: The Five Fault Types
1. Watchdog Trips (Scan Overrun)
The watchdog timer is a hardware safety net. If a scan takes longer than the configured limit (typically 100 ms to 500 ms, but configurable), the CPU faults and stops. You will see a solid red LED on the CPU, a diagnostic buffer entry, and often an error code in the 1x4xx range on Siemens or a Major Fault Type 6 Code 1 on Rockwell.
The usual causes: someone added a long FOR loop without an exit condition, a recipe download routine iterates through a 10,000-element array every scan, or a poorly written UDT initialisation block runs at startup and hogs the CPU. To find it, check the CPU diagnostics first. On TIA Portal, open the diagnostic buffer in STEP 7 or the Online and Diagnostics view. On Studio 5000, look at the Controller Diagnostics under Controller Properties. The buffer will usually tell you exactly which task or program overran.
2. Missed Input Pulses
A high-speed encoder or a fast proximity sensor generates pulses in the 1 to 5 ms range. Your scan time is 20 ms. You will miss most of those pulses. The symptom is a counter that reads low counts compared to the actual part count, or a 'part present' detection that works at slow speeds but fails when the conveyor runs fast.
The fix is not to speed up your scan. Use high-speed counter (HSC) inputs. On a CompactLogix or MicroLogix, dedicated HSC channels handle pulse rates up to 1 MHz in hardware, completely independent of the scan. On an S7-1200, the built-in HSC inputs (I0.0 through I0.5) count in hardware and you read the count value from the HSC DB each scan. The PLC logic just reads the accumulated value, which does not change with scan timing.
3. One-Scan Pulse Disappearing
This is the opposite problem: your logic generates a one-shot (OSR/OSF or P_TRIG/N_TRIG) output, but a downstream rung that depends on it does not respond. The one-shot coil is true for exactly one scan, roughly 10 to 20 ms. If the downstream function block needs to see a rising edge and it is in a different task that runs asynchronously, it might catch the pulse or it might not.
The reliable pattern is to latch the one-shot result into a binary tag, use that latched tag across tasks or programs, then clear the latch once the downstream code has consumed it. Never pass a raw one-shot bit across task boundaries in a multi-task controller.
4. Rung Order Race Conditions
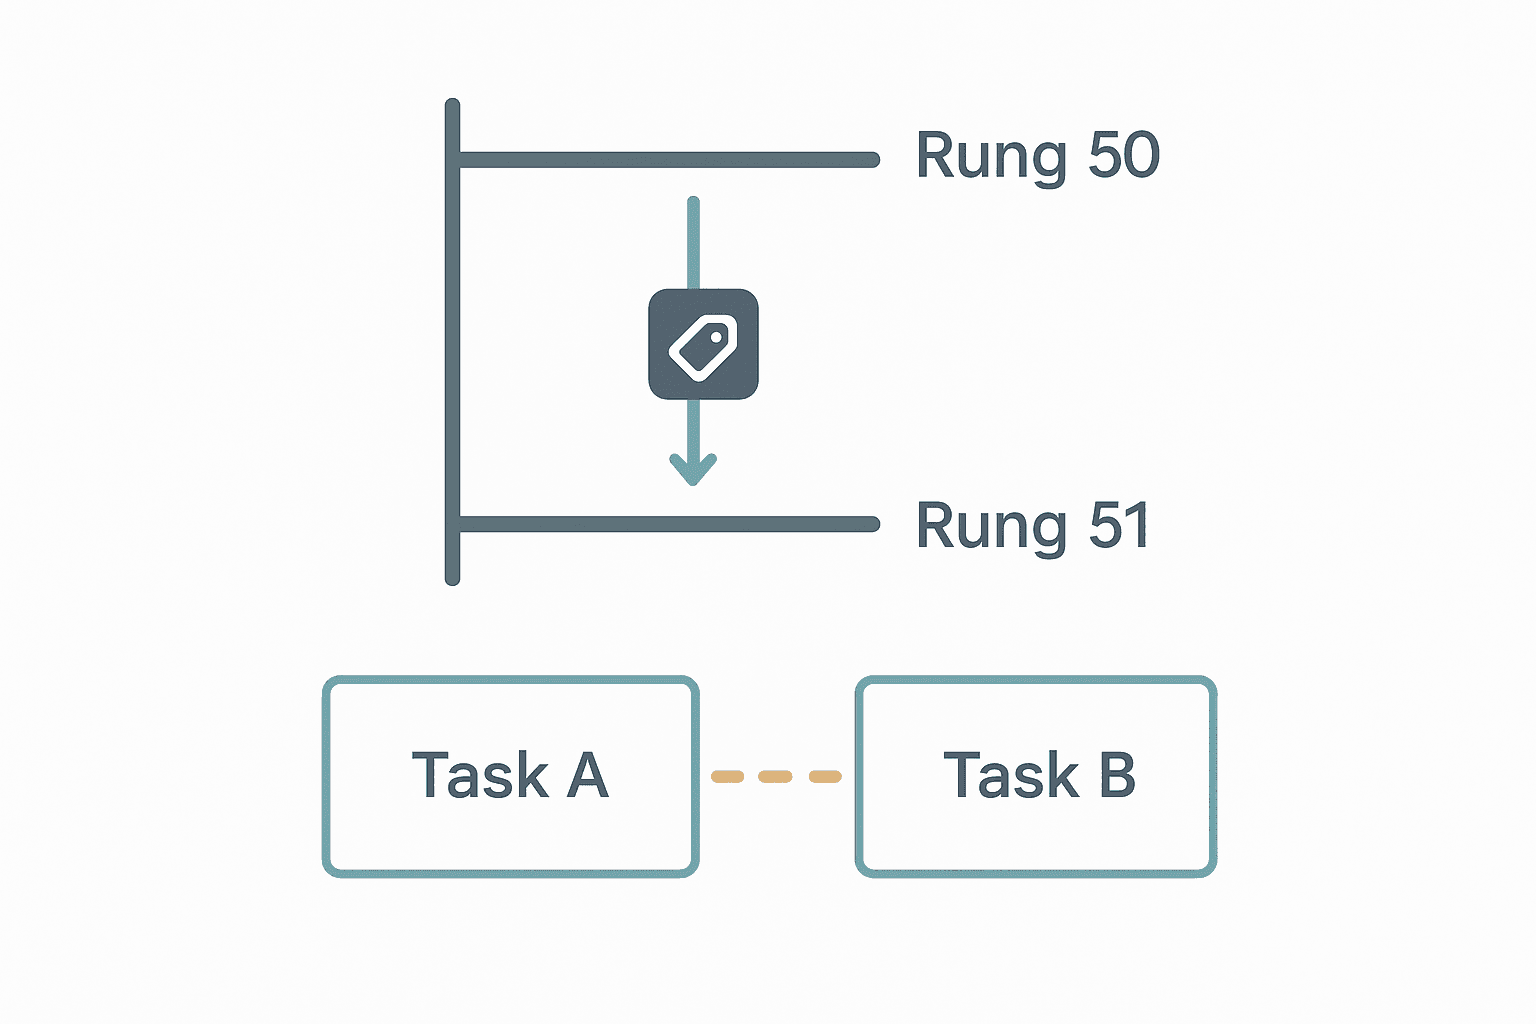
Ladder logic solves top to bottom, left to right, within a single scan. This means a tag set on rung 50 is immediately visible to rung 51 in the same scan. But a tag set in Routine A (which runs before Routine B in the same task) is visible to Routine B in the same scan. This is actually by design, and it is useful. The race condition happens when you accidentally depend on this order and then someone reorders the routines or copies rungs to a different location.
A classic example: a fault detection rung in Routine B clears a 'machine running' flag, and the motion control rung in Routine A already consumed that flag this scan, so the stop command does not take effect until the next scan. At 20 ms, that is usually fine. But if the machine is moving at speed and that 20 ms delay allows it to overtravel, you have a real problem. The fix is to put safety-critical stops as close to the top of the program execution order as possible.
5. Timer and Counter Resolution vs Scan Time
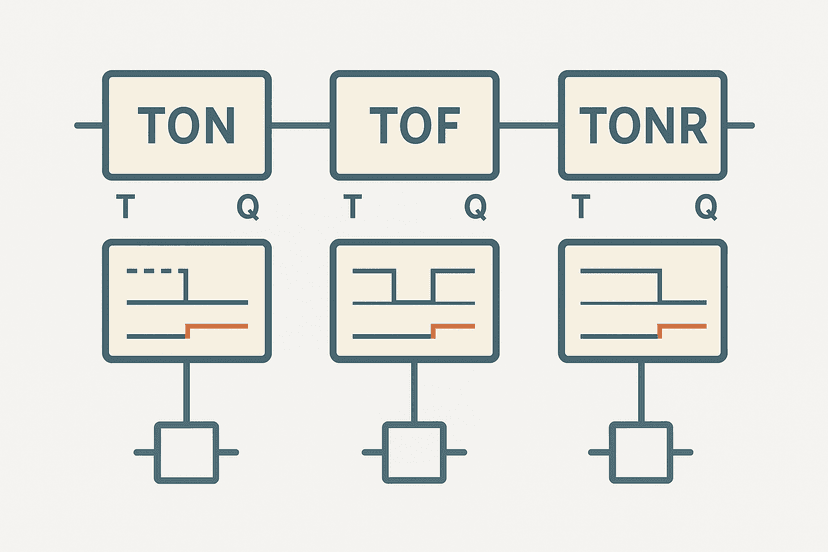
TON and TOF timers in most PLCs accumulate time based on system clock ticks, not scan counts, so they are reasonably accurate even with variable scan times. But there is a catch: the timer done bit (DN or Q) is only evaluated once per scan. If your scan is 25 ms and your timer preset is 20 ms, the done bit will not assert until the scan after the timer has already expired. The actual delay is your preset plus up to one full scan time. For most applications, 25 ms of jitter is nothing. But for a precision dosing valve on a filling machine, it can cause measurable volume errors.
The correct approach for tight timing is to use a fast cyclic interrupt task (OB30 on Siemens, a periodic task at 1 to 5 ms on Studio 5000) for the timing-critical logic, leaving the main task for general sequencing. This is covered in detail when you look at motion and servo setups, but it applies equally to any application where timing jitter above 5 ms matters. See the TON, TOF and TONR Timers post for how timer resolution varies across platforms.
How to Measure Your Actual Scan Time
Do not guess. Measure it. Every modern PLC gives you the actual scan time somewhere in the diagnostics.
| Platform | Where to Find Scan Time | Typical Location |
|---|---|---|
| Siemens S7-1200/1500 | OB1 cycle time in diagnostic buffer | Online & Diagnostics > Cycle Time |
| Rockwell CompactLogix | Task Properties > Last Scan, Max Scan | Controller Properties > Tasks |
| CODESYS 3.5 | Task monitoring in Task Configuration | Online > Task > Statistics |
| Omron Sysmac NJ/NX | Controller Status in Sysmac Studio | Controller > CPU Status > Cycle Time |
| Mitsubishi iQ-R | SM510/SM511 special relays (min/max scan) | GX Works3 > Watch Window |
On Studio 5000, you can also timestamp a tag with the GSV (Get System Value) instruction reading WALLCLOCKTIME into a LINT tag at the start and end of a suspected slow routine. Subtract the two values to get microsecond-accurate routine execution time. This is the fastest way to pinpoint which routine is eating your scan budget.
A Practical Ladder Fix: Input Pulse Stretching
When you cannot use an HSC input (wrong card type, no spare channels), and you have a sensor that fires a pulse shorter than one scan, the software solution is a TON-based pulse stretcher. The sensor fires the TON, which holds a stretched output tag true for a minimum of one full scan period, giving the downstream logic a guaranteed window to see it. Here is the pattern in Studio 5000 ladder:
Input Pulse Stretcher: Catch Short Pulses Across Scan Boundaries (Studio 5000). Ladder logic (4 rungs): Rung 0: examine if PartDetect_Sensor is on (XIC), then latch output Stretch_Latch (OTL). Rung 1: examine if Stretch_Latch is on (XIC), then TON on Stretch_Timer. Rung 2: examine if Stretch_Timer.DN is on (XIC), then unlatch output Stretch_Latch (OTU), then either RES on Stretch_Timer. Rung 3: examine if Stretch_Latch is on (XIC), then examine if Part_Count.DN is off (XIO), then CTU on Part_Count. Rung 1: Any rising edge from PartDetect_Sensor latches Stretch_Latch on. Rung 2: TON starts timing with a 50 ms preset (2 to 5 scan periods at typical scan rates). Rung 3: When the timer expires it unlatches and resets, making the circuit ready for the next pulse. Rung 4: The stretched latch drives a CTU counter, which now reliably sees every part even if the raw sensor pulse is shorter than one scan. Adjust the TON preset to be at least 2x your maximum expected scan time.
The diagram above evaluates one scan. Run these exact rungs on a real scan cycle to watch the latching and the timers behave.
Run this in the simulatorScan Cycle Problems That Look Like Hardware Faults
Here is a short list of symptoms that technicians blame on hardware but are actually scan-related. Keep this in your back pocket:
- Output flickers once per second even though the rung looks correct: the controlling tag is being reset by a different rung lower in the program and re-set by a coil higher up, creating a one-scan glitch visible on an oscilloscope but invisible during normal online monitoring.
- Solenoid chatters at low conveyor speeds but not high speeds: the sensor dwell time at low speed is long enough, but at high speed the part passes within one scan and the output never asserts.
- Timer-controlled valve opens slightly too long: preset is correct but scan time jitter adds up to 30 ms of extra open time, causing overfill.
- Counter reads 99 when 100 parts ran: one part passed the sensor during the output scan phase when the input image table was not being updated, so the pulse hit between snapshots.
- Interlock clears itself briefly: two rungs both write the same output coil (OTE) at different points in the program. The last rung wins. The first rung's true evaluation is overwritten before the outputs are written to hardware.
Reducing Scan Time When You Are Near the Limit
If your diagnostic data shows you are consistently above 70% of the watchdog limit, do not just increase the watchdog timeout. That just delays the fault. Fix the root cause.
- Move time-critical and high-speed logic into a periodic interrupt task (1 to 5 ms period). Put general HMI updates and recipe management in a slower background task (100 to 500 ms period).
- Replace FOR loops that run to completion every scan with a state machine that advances one step per scan. A 1,000-iteration loop at 1 ms per iteration adds 1 second to your scan time.
- Reduce comms polling. Every MSG instruction or EtherNet/IP explicit message that runs every scan adds overhead. Gate them behind a timer or a change-detection bit.
- Check add-on instruction (AOI) nesting. Deeply nested AOIs are convenient but they can hide significant execution time. Profile each AOI individually using GSV timestamps.
- On Siemens, review your OB30 and OB35 cyclic interrupt periods. Interrupt OBs with very short periods (1 ms) preempt OB1 repeatedly and inflate the apparent OB1 cycle time.
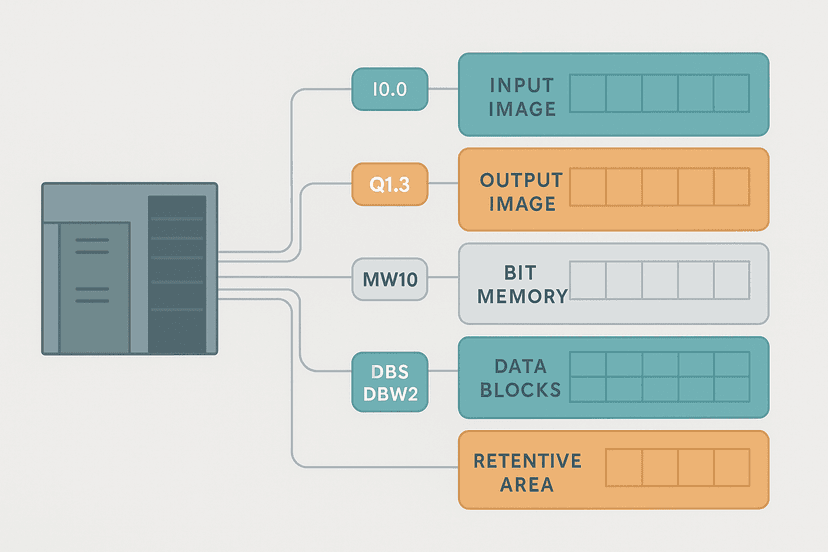
For a deeper look at how input and output addressing affects what the scan cycle reads and writes each pass, the PLC Memory and Addressing Explained post covers the input image table, output image table and internal memory layout across multiple platforms.
Quick Diagnostic Checklist
- Check the actual scan time in the CPU diagnostics before assuming hardware failure.
- Verify there are no duplicate OTE coils for any output that is behaving unexpectedly. Most platforms have a cross-reference or coil usage report.
- For fast input signals under 10 ms, always ask whether an HSC input or interrupt-driven input (input interrupt OB in TIA Portal) is the right solution.
- If one-shots are crossing task or program boundaries, latch them into a persistent bit and clear that bit explicitly.
- Run the machine at full production speed and log max scan time. Compare to the watchdog limit. Anything above 60% warrants investigation.
- Check whether any comms MSG blocks are set to run every scan without a trigger condition. Gate them.
Frequently asked questions
What causes a PLC watchdog fault?
Why does my PLC miss fast input pulses?
Can two rungs control the same output coil in ladder logic?
How much jitter do PLC TON timers have?
What is the difference between a scan cycle race condition and a hardware wiring fault?
How do I reduce PLC scan time without changing hardware?
Now build it
You have just read about TON. Reading a rung and making one behave are different skills, and the second one is the job.
Flasher
Intermediateabout 15 minTwo timers chained in a loop make a lamp blink: the classic two-TON flasher used for warning beacons everywhere. Your first taste of timers driving each other.
Build this rungFree, no signup, runs in your browser. See all 16 exercises.
Was this helpful?