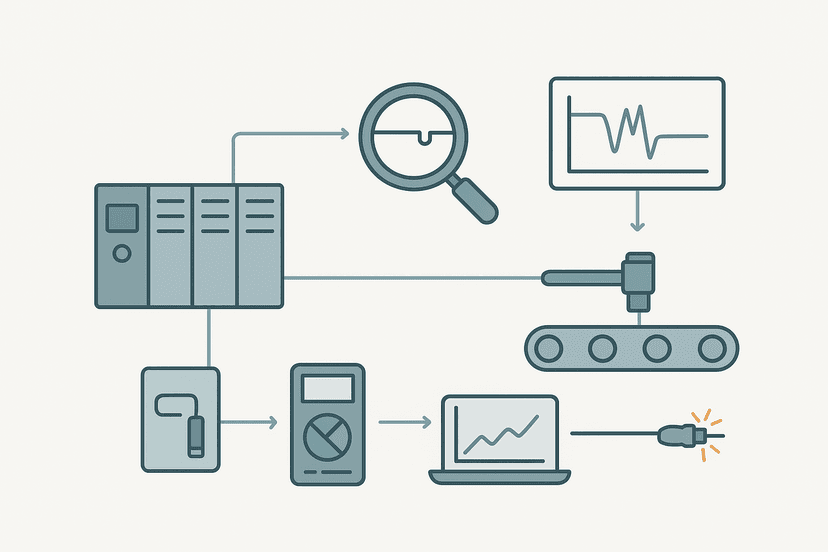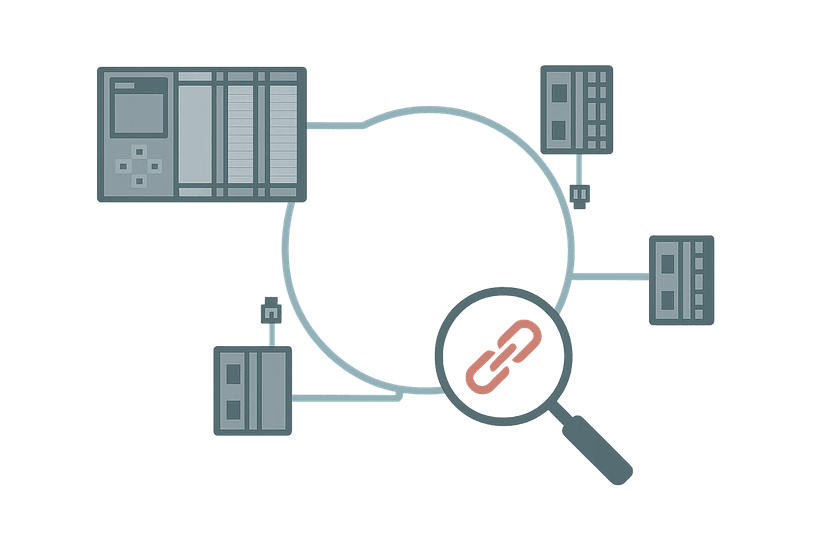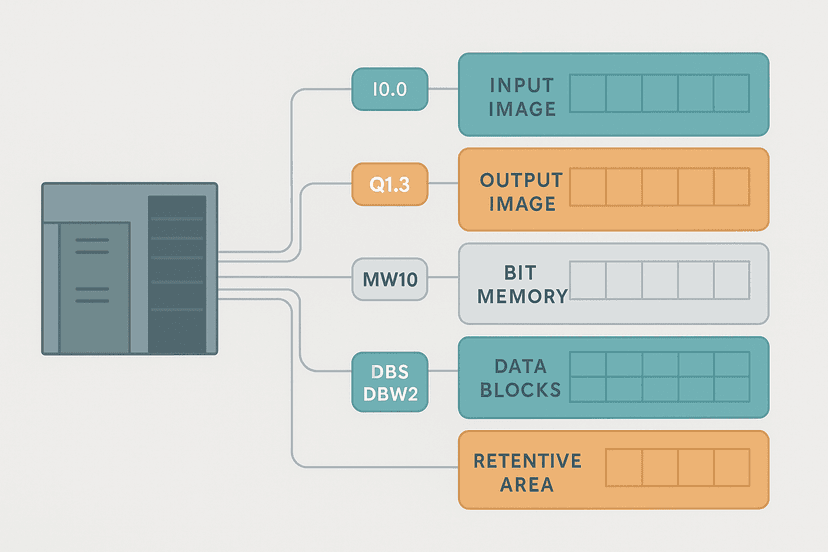
PLC Troubleshooting with Online Monitoring
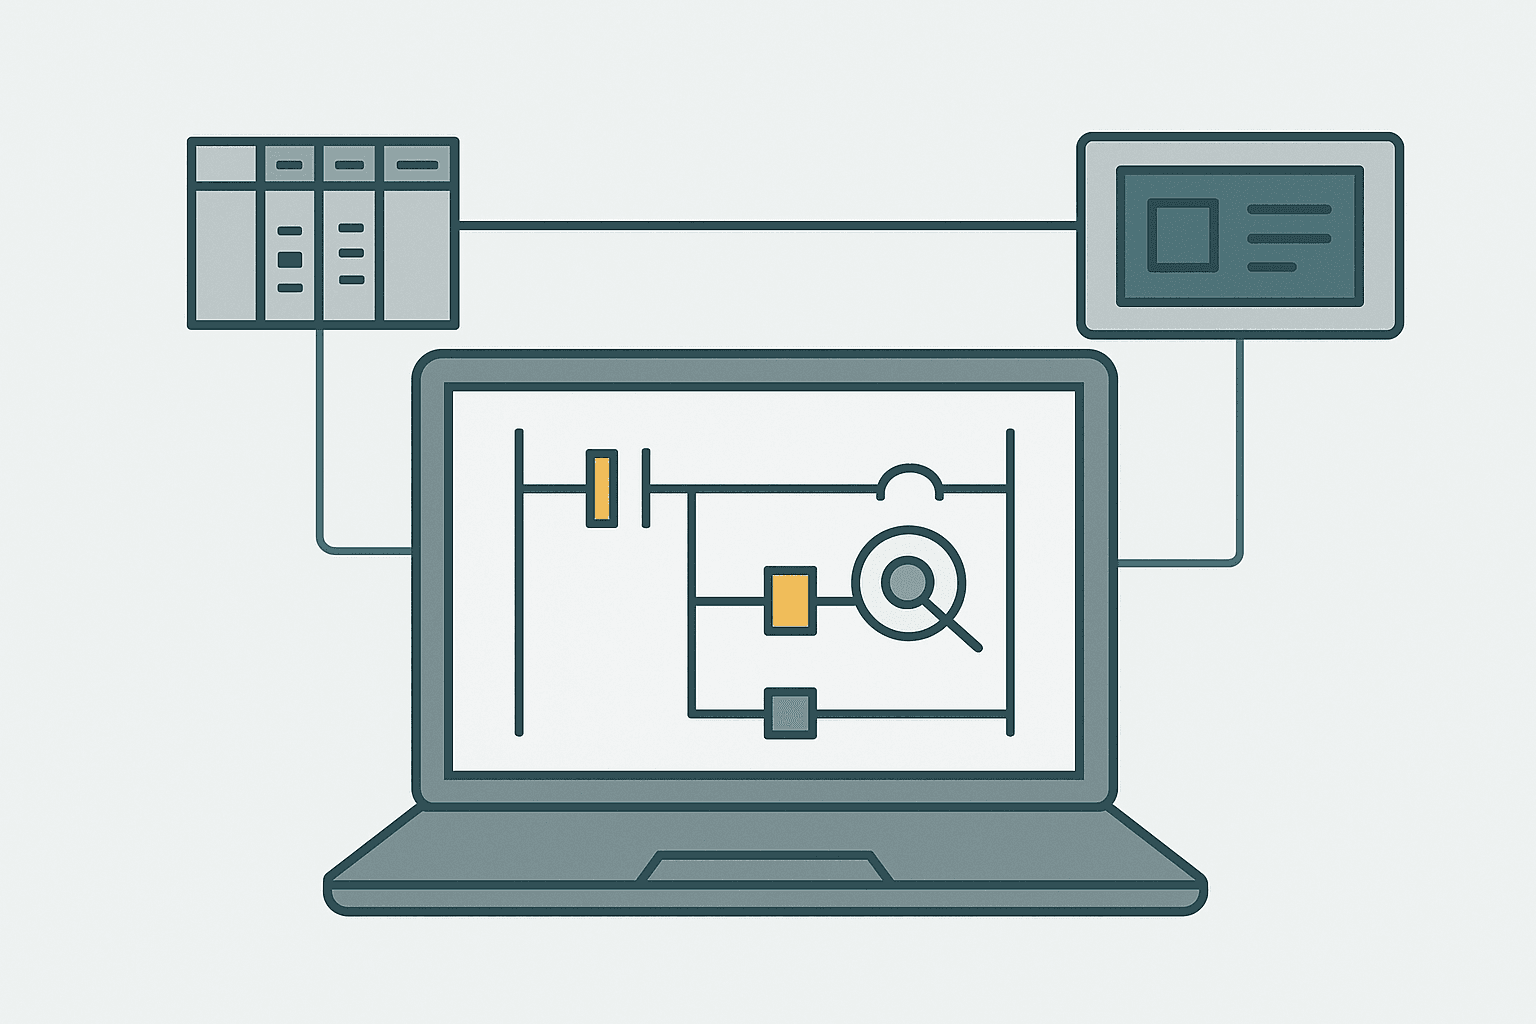
Online monitoring is the single most powerful troubleshooting tool you have, and most engineers underuse it. Not because they do not know it exists, but because they do not have a systematic method. They go online, click around a few rungs, scratch their heads, and eventually start swapping hardware. That wastes time and sometimes creates new faults.
This post walks through a structured, step-by-step approach to PLC troubleshooting using live online monitoring in Studio 5000 / Logix, with notes for TIA Portal and CODESYS where the workflow differs. The same logic applies on any platform.
Why Online Monitoring Is Your First Move
A PLC in run mode with a programming terminal connected shows you exactly what the processor sees in real time: which contacts are open or closed, which coils are energised, what value is sitting in every tag. The scan cycle is typically 5 to 20 ms, so the display updates fast enough to catch most faults. You are not guessing based on indicator lights or HMI messages. You are reading the actual logic state.
The key discipline is: go online before you touch anything physical. A lot of faults are in the logic or in field wiring that shows up clearly in the tag browser. Pulling cards, swapping sensors or bumping setpoints first turns a 10-minute software diagnosis into a 2-hour hardware hunt.
PLC Troubleshooting Steps: The Online Workflow
Step 1: Connect and Check Controller Status
Open Studio 5000, go online to the controller. The first thing to read is the controller status banner at the top of the screen: RUN, FAULT, or REM PROG. If you see a fault, open the controller properties fault tab immediately. Every Logix controller stores the fault code, the fault type (minor vs major), and the exact routine and rung number where the fault occurred. A Type 4, Code 20 fault means a task watchdog overrun, for example. That alone tells you the fault is a timing or scan-time problem, not a field device problem.
Step 2: Find the Output That Is Not Doing What You Expect
Describe the symptom as precisely as possible: 'Conveyor 3 does not start when the start button is pressed.' That gives you an output tag to start from: Conv3_Run. In Studio 5000, press Ctrl+F to open the cross-reference and search for Conv3_Run. You will see every rung in every routine that reads or writes that tag.
Go to the rung that has Conv3_Run as an OTE or OTL coil. That is the output rung. Now look at the rung online. If the output coil is highlighted (true), but the physical output is not energised, the fault is in wiring or the I/O module, not in logic. If the coil is not highlighted (false), the logic is blocking it and you need to find why.
Step 3: Walk the Rung Backwards from the Coil
With the output rung open in online mode, look at each contact from right to left. Any contact that is not highlighted is an open condition blocking the rung. That contact is your next clue. It might be:
- An XIC (Examine If Closed) contact that should be true but is false: the tag or physical input is off when it should be on.
- An XIO (Examine If Open) contact that should be false but is true: something is active that should not be.
- A comparison instruction (GRT, LES, EQU) that is false because a value is out of range.
- A timer or counter done bit that has not set yet.
Note the tag name of the blocking contact. Cross-reference it. If it is a physical input tag like Conv3_StartPB, go to the I/O tree and check the module status. Is the bit reading 0 while the button is physically pressed? That is a wiring or sensor fault. If it is an internal bit like Conv3_InterlockOK, find where that bit is written and repeat the same backwards walk on that rung.
Step 4: Use the Tag Monitor and Watch Window
Once you have a suspicious tag, open a Watch Window (in Studio 5000, right-click the tag and choose 'Monitor Tag'). You can add multiple tags and watch their live values side by side. This is invaluable for analog values, counters and timer accumulators. If Conv3_SpeedRef is reading 0 when it should be 750, that explains why a speed-enable comparison is blocking the rung.
In TIA Portal, the equivalent is the Watch and Force Table (Watches tab). In CODESYS, it is the Watch List. All three let you log tag values over time if you add them to a trace or data log, which is useful for intermittent faults that do not stay present while you are looking.
Step 5: Check I/O Module Diagnostics
In the I/O tree in Studio 5000, every module has a status icon. A yellow triangle means a module fault or communication issue. Double-click the module and open its Module Properties. The Connection tab shows whether the connection to the backplane or remote adapter is healthy. The Fault tab shows the exact fault code. Common ones are:
| Fault Code | Meaning | Likely Cause |
|---|---|---|
| 16#0001 | Connection timeout | Network cable, switch port or device power loss |
| 16#0002 | Connection request error | IP address conflict or wrong module type in rack |
| 16#0010 | Module hardware fault | Module needs replacement or firmware update |
| 16#0020 | Input channel fault | Open-circuit on input wiring, blown fuse on sensor supply |
| 16#0100 | Output short circuit | Shorted load, overcurrent on output channel |
Step 6: Use Forces Only as a Last Resort
Forcing a tag means overriding what the PLC logic writes to it and jamming it to a fixed value. It is useful for isolating whether a fault is in the logic or the field device, but it comes with real risk. If you force an output on, the machine moves. People can get hurt.
The legitimate use for forces is: force an input tag true to simulate a sensor that you cannot physically actuate safely, then watch whether the downstream logic responds correctly. If it does, the fault is in the sensor or its wiring, not the logic. If it does not, the fault is in the logic and you continue the rung walk.
A Real Troubleshooting Example
Here is a scenario I have seen more than once. A pick-and-place arm is not extending. The operator says the start button does nothing. Online monitoring reveals the Arm_Extend_Sol output coil is false. Walking the rung backwards:
- XIC(Cycle_Active) is true. OK.
- XIC(Part_In_Position) is true. OK.
- XIO(Arm_Fault) is FALSE, meaning Arm_Fault is TRUE. That is the blocker.
- Cross-reference Arm_Fault: it is set by a rung that checks XIC(Arm_RetractLS_OK) which is false.
- The retract limit switch is not reading. Go to the I/O module: input channel 7 shows a channel fault (open circuit).
- Check the wiring: the 24 V supply wire to the limit switch has a broken ferrule inside the terminal. Crimp it, and the fault clears.
Total time: 12 minutes from symptom to repair. Without online monitoring, you might have swapped the solenoid valve, checked the pneumatic supply, tested the output module, all before finding a broken wire at a terminal block.
Ladder Rung: Interlock Fault Detection with Online Monitoring Tags
The rung below shows the arm extend logic from the example above in a form you can actually build and test. It includes the retract limit switch interlock, a fault latch on the rising edge of Arm_Fault, and an HMI acknowledge path. Go online with this in Studio 5000 and you will see exactly which contact is blocking the extend output.
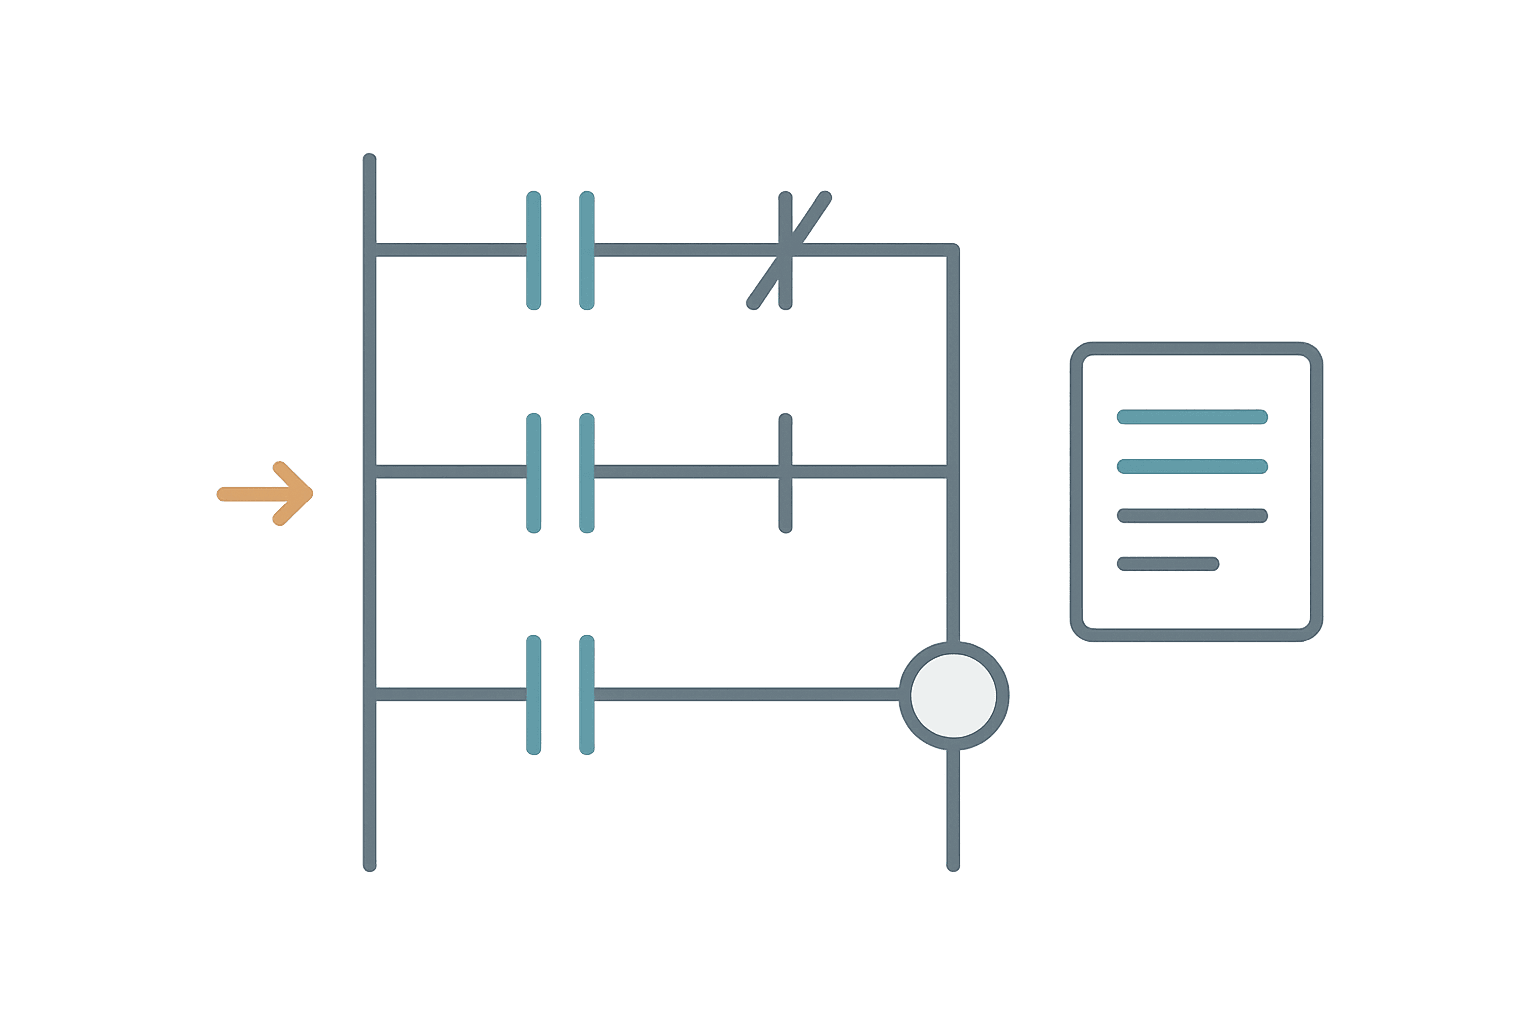
Arm Extend Interlock with Fault Latch (Studio 5000 / Logix). Ladder logic (4 rungs): Rung 0: examine if Cycle_Active is on (XIC), then examine if Part_In_Position is on (XIC), then examine if Arm_RetractLS_OK is on (XIC), then examine if Arm_FaultLatch is off (XIO), then energize output Arm_Extend_Sol (OTE). Rung 1: examine if Arm_Extend_Sol is on (XIC), then examine if Arm_ExtendLS_OK is off (XIO), then TON on Arm_ExtendTimeout. Rung 2: examine if Arm_ExtendTimeout.DN is on (XIC), then examine if Arm_Fault_OS is on (XIC), then latch output Arm_FaultLatch (OTL). Rung 3: examine if Arm_FaultLatch is on (XIC), then examine if HMI_FaultAck is on (XIC), then examine if Arm_Extend_Sol is off (XIO), then unlatch output Arm_FaultLatch (OTU). Rung 1: Arm extends only if cycle is active, part is in position, retract LS is confirmed, and no fault latch is set. Online monitoring shows which of the four conditions is blocking. Rung 2: A TON starts when the solenoid fires but the extend LS has not confirmed. Rung 3: If the timeout expires, a one-shot sets the fault latch. Rung 4: The operator acknowledges via HMI and the latch clears once the solenoid de-energises. The fault latch tag is the key tag to watch in the Watch Window during diagnosis.
The diagram above evaluates one scan. Run these exact rungs on a real scan cycle to watch the latching and the timers behave.
Run this in the simulatorCross-Reference: The Feature Most Engineers Forget
Cross-reference (Ctrl+F in Studio 5000, Ctrl+Shift+F in TIA Portal) shows every rung that reads or writes a tag. This is non-negotiable for programs with more than a few dozen rungs. When you find a suspicious tag, cross-reference it immediately. You want to see:
- Which routines write to the tag (these are the sources of the value).
- Which routines read the tag (these are places affected by the fault).
- Whether the tag is written in more than one place (a common source of unexpected overrides).
- Whether an OTL/OTU pair exists and whether the unlatch rung is ever reaching its coil.
One specific gotcha: a tag written by a Move or Copy instruction in a periodic task will override whatever the ladder sets in the main task. If a tag looks right in the ladder but keeps resetting, cross-reference it and look for non-ladder writes. This catches about one in ten 'the logic is wrong' complaints that are actually configuration issues.
When Online Monitoring Is Not Enough
Online monitoring shows the current state. Intermittent faults that clear before you go online need a different approach. The best tool here is a data log or trend on the suspicious tags. In Studio 5000, the Logix Designer Trend tool lets you sample up to about 50 tags at scan rate. Set it running, wait for the fault to recur, then examine the trace. You will usually see the exact moment the tag changed and which tag changed first.
For intermittent sensor dropouts specifically, the sensor dropout counter ladder technique covered in the Intermittent Sensor Faults post is a good companion to the online monitoring workflow here. Both approaches together give you a complete picture.
Quick Reference: Online Troubleshooting Workflow
| Step | Action | Tool / Feature |
|---|---|---|
| 1 | Check controller status and fault log | Status banner, Controller Properties > Faults |
| 2 | Identify the output that is misbehaving | I/O tree, HMI alarm, operator description |
| 3 | Find the output coil rung via cross-reference | Ctrl+F in Studio 5000 |
| 4 | Walk the rung backwards to find the blocking contact | Online ladder view, highlighted contacts |
| 5 | Cross-reference the blocking tag to find its source | Cross-reference list |
| 6 | Watch suspicious tags live | Watch Window / Tag Monitor |
| 7 | Check I/O module diagnostics if a physical input/output is suspect | Module Properties > Connection / Fault |
| 8 | Use forces only in a safe state to isolate hardware vs logic | Force Table (enable then set) |
| 9 | Use trending for intermittent faults | Logix Trend, TIA Portal Trace, CODESYS Scope |
Frequently asked questions
What does it mean to go online with a PLC?
Is it safe to use PLC force tables during troubleshooting?
How do I find which rung is blocking a PLC output?
What is the difference between a minor fault and a major fault in a Rockwell Logix controller?
How do I troubleshoot an intermittent PLC fault that is not present when I go online?
Can I go online to a PLC without interrupting production?
Now build it
You have just read about XIC and XIO and OTE. Reading a rung and making one behave are different skills, and the second one is the job.
Start / Stop Circuit
Beginnerabout 10 minThe first circuit every controls engineer learns: a motor that starts on a button press, keeps running when the button is released, and stops on a stop button, with stop always winning.
Build this rungFree, no signup, runs in your browser. See all 16 exercises.
Was this helpful?