Omron PLC Error Codes: How to Read and Fix Them
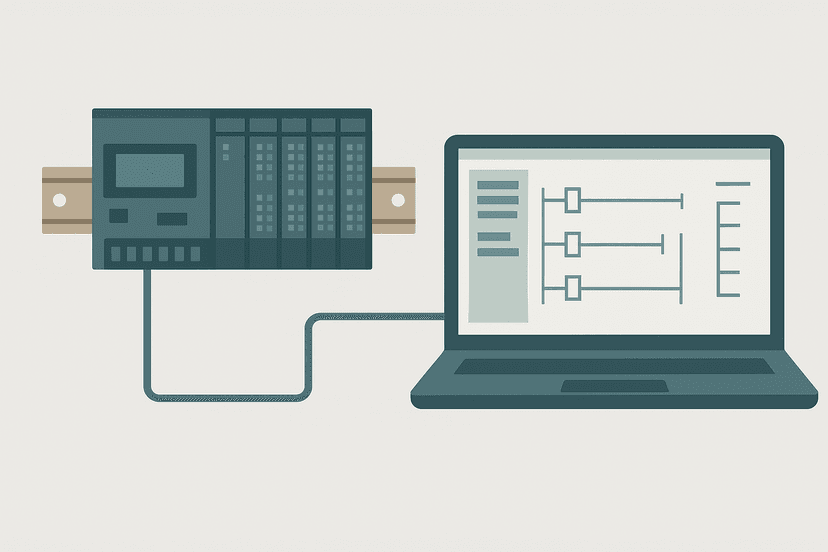
Your Omron PLC has stopped, the ERR LED is on, and production is waiting. The error code on the display or in the software tells you exactly what went wrong, if you know how to read it. This guide walks through the Omron error code structure for both the NX/NJ (Sysmac) and the CJ/CS/CP families, shows you where to find the full details, and gives you a repeatable process to get back running without guessing.
What Are Omron PLC Error Codes?
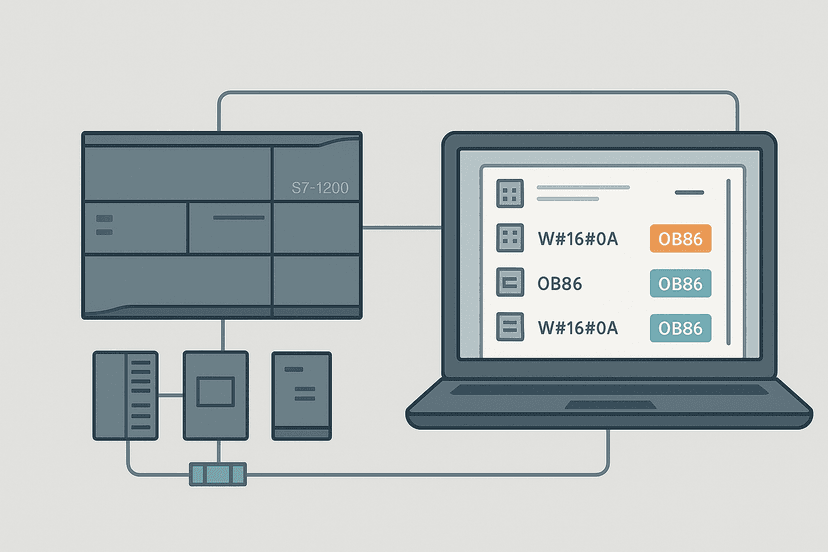
Omron PLC error codes are numeric identifiers the CPU logs when it detects an abnormal condition, ranging from a low battery warning to a full CPU halt. Each code maps to a severity level, a description, and a recommended remedy in Omron's documentation. On NX/NJ controllers the codes appear in the Sysmac Studio Event Log as hexadecimal values with a severity tag. On older CJ, CS, and CP hardware they appear on the front-panel seven-segment display and in CX-Programmer's error log as decimal or hex values.
Severity Levels: The First Thing to Check
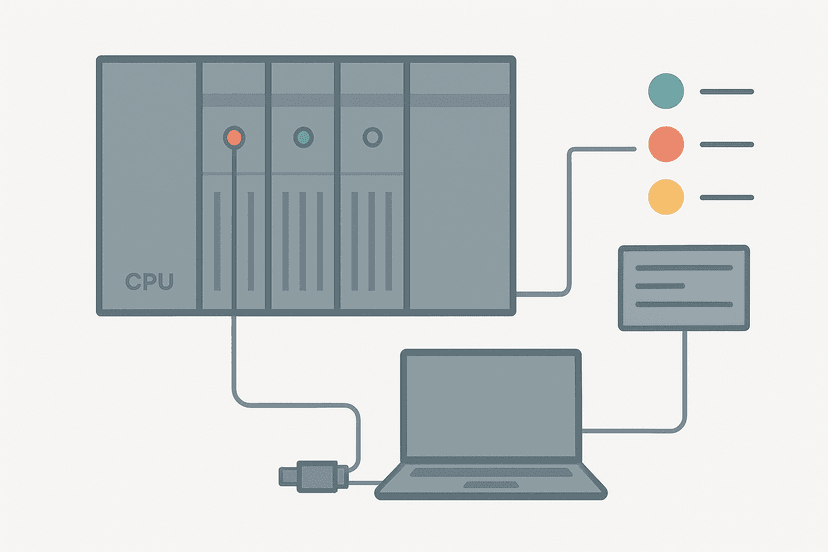
Before you chase the specific code number, understand what severity class you are dealing with. On NX/NJ controllers Omron uses four levels:
| Severity Level | LED State | Program Execution | Typical Cause |
|---|---|---|---|
| Major Fault | ERR solid red | Stopped | Hardware failure, illegal memory access, corrupted project |
| Partial Fault | ERR flashing red | Affected task stopped, others run | I/O unit fault, task-specific error |
| Minor Fault | ERR solid yellow | Continues | Battery low, clock error, non-critical hardware |
| Observation | No ERR LED | Continues | User-defined warning, threshold breach |
On CJ/CS series the terminology is slightly different: Fatal Errors stop the CPU, Non-Fatal Errors let it keep running. On CP-series standalone units the front-panel display flashes the error code while the PWR and ERR LEDs tell you at a glance whether you have a fatal or non-fatal condition.
Reading Omron Error Codes in Sysmac Studio (NX/NJ)
If you are working on an NX1P2, NX102, NJ301, or NJ501, Sysmac Studio is your main diagnostic tool. The Omron Sysmac Studio getting-started guide covers the connection basics, so I will focus on the fault workflow here.
- Connect via USB or Ethernet and go online (Controller > Online).
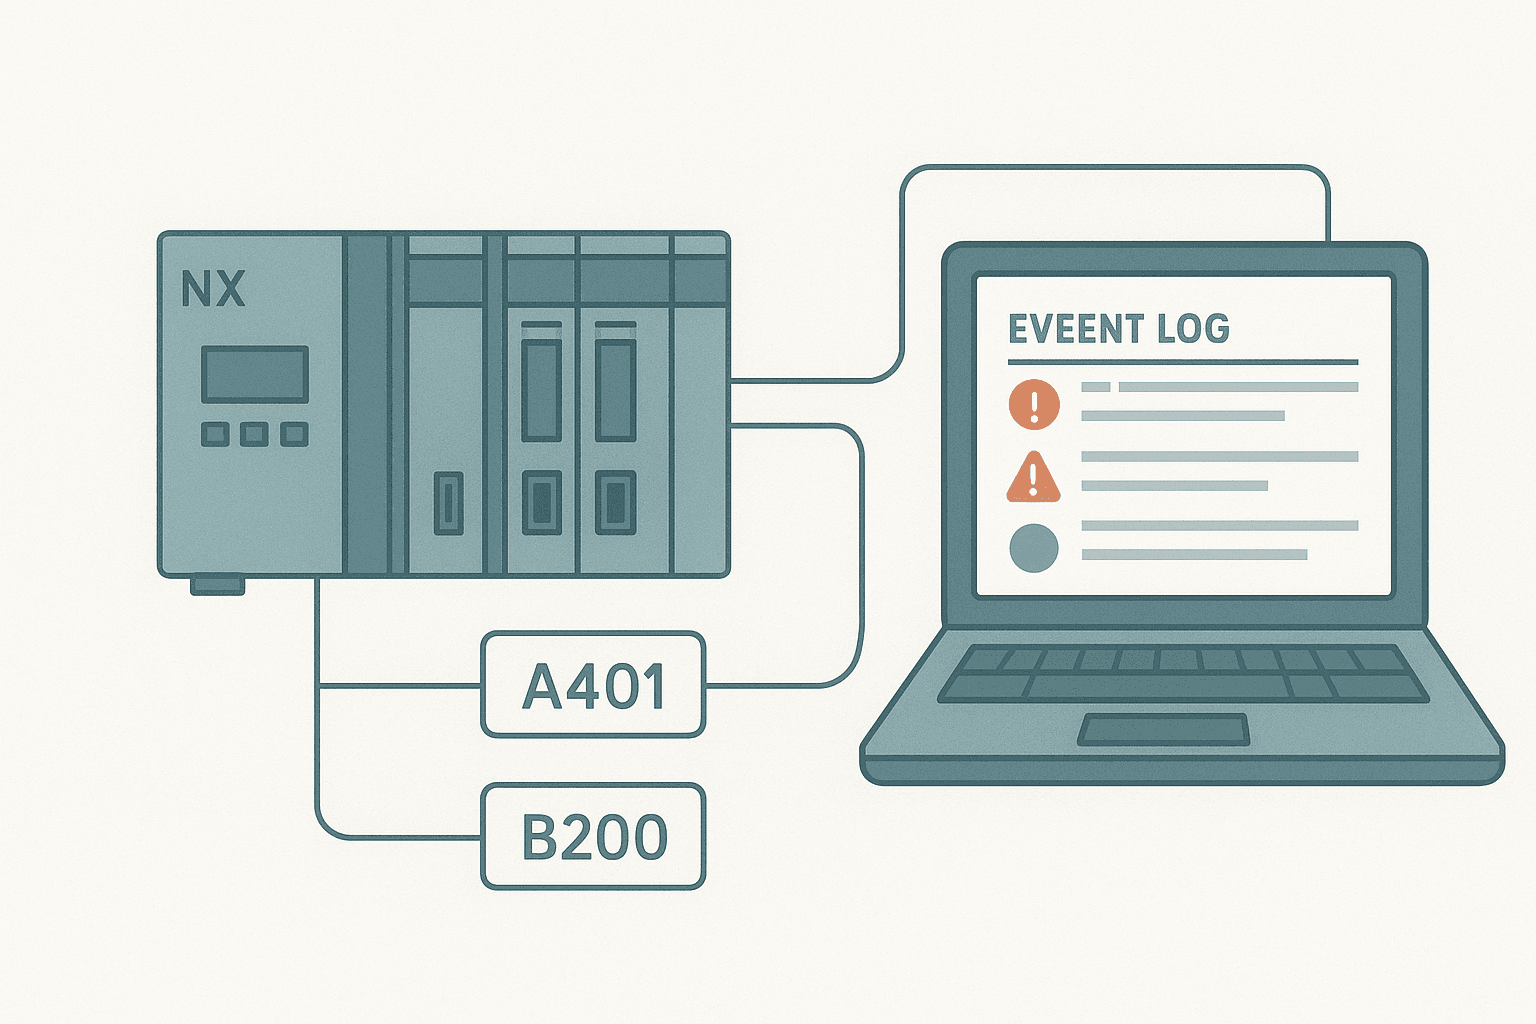
- Open the Event Log: Controller menu > Event Log, or click the bell icon in the toolbar.
- The log lists all active and historical events with timestamp, severity icon, event name, event code (hex), and source.
- Click any entry to expand it. The detail pane shows Description, Cause, and Correction.
- For errors tied to a specific I/O unit, the Source column shows the unit name (e.g. NX-OD3256 Slot 3). Walk to that slot and check the LED.
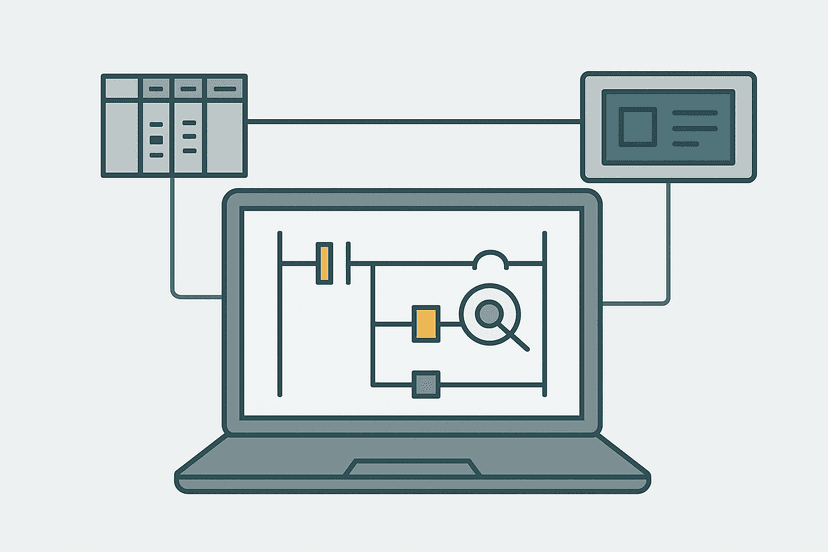
- For program errors (event codes 8400 hex range), double-click the entry. Sysmac Studio jumps to the faulting line in your structured text or ladder code.
- Once the root cause is resolved, click Clear All Active Events. If the button is greyed out, the triggering condition is still present.
A practical tip: the Event Log persists through power cycles on NX/NJ. That history is gold when you arrive on site after a midnight fault. Filter by severity to see only Major and Partial faults, and look at the timestamps to reconstruct the sequence of events.
Reading Omron Error Codes in CX-Programmer (CJ/CS/CP)
For CJ2M, CJ1M, CS1D, and CP-series units, CX-Programmer is the tool. Go online, then open PLC menu > Error Log. You get a list of current and historical faults with error codes in hex. The columns show Error Type (Fatal/Non-Fatal), Error Code, and a brief description.
Cross-reference the hex code against the relevant hardware or programming manual. Omron publishes these as free PDFs: the SYSMAC CJ-series CPU Unit Hardware User's Manual (W472) for CJ2, and W451 for the CP1H. The remedy section in those manuals is more detailed than the one-liner in CX-Programmer, especially for I/O unit faults.
Common Omron Error Codes and What They Mean
| Error Code | Platform | Name | Likely Cause | First Fix |
|---|---|---|---|---|
| A401 (hex 80F1) | CJ/CS | Battery Error | Backup battery exhausted | Replace battery, then clear error |
| 8400 hex | NX/NJ | User Program Execution Error | Illegal array index or null pointer in ST code | Open Event Log, click entry, fix highlighted code line |
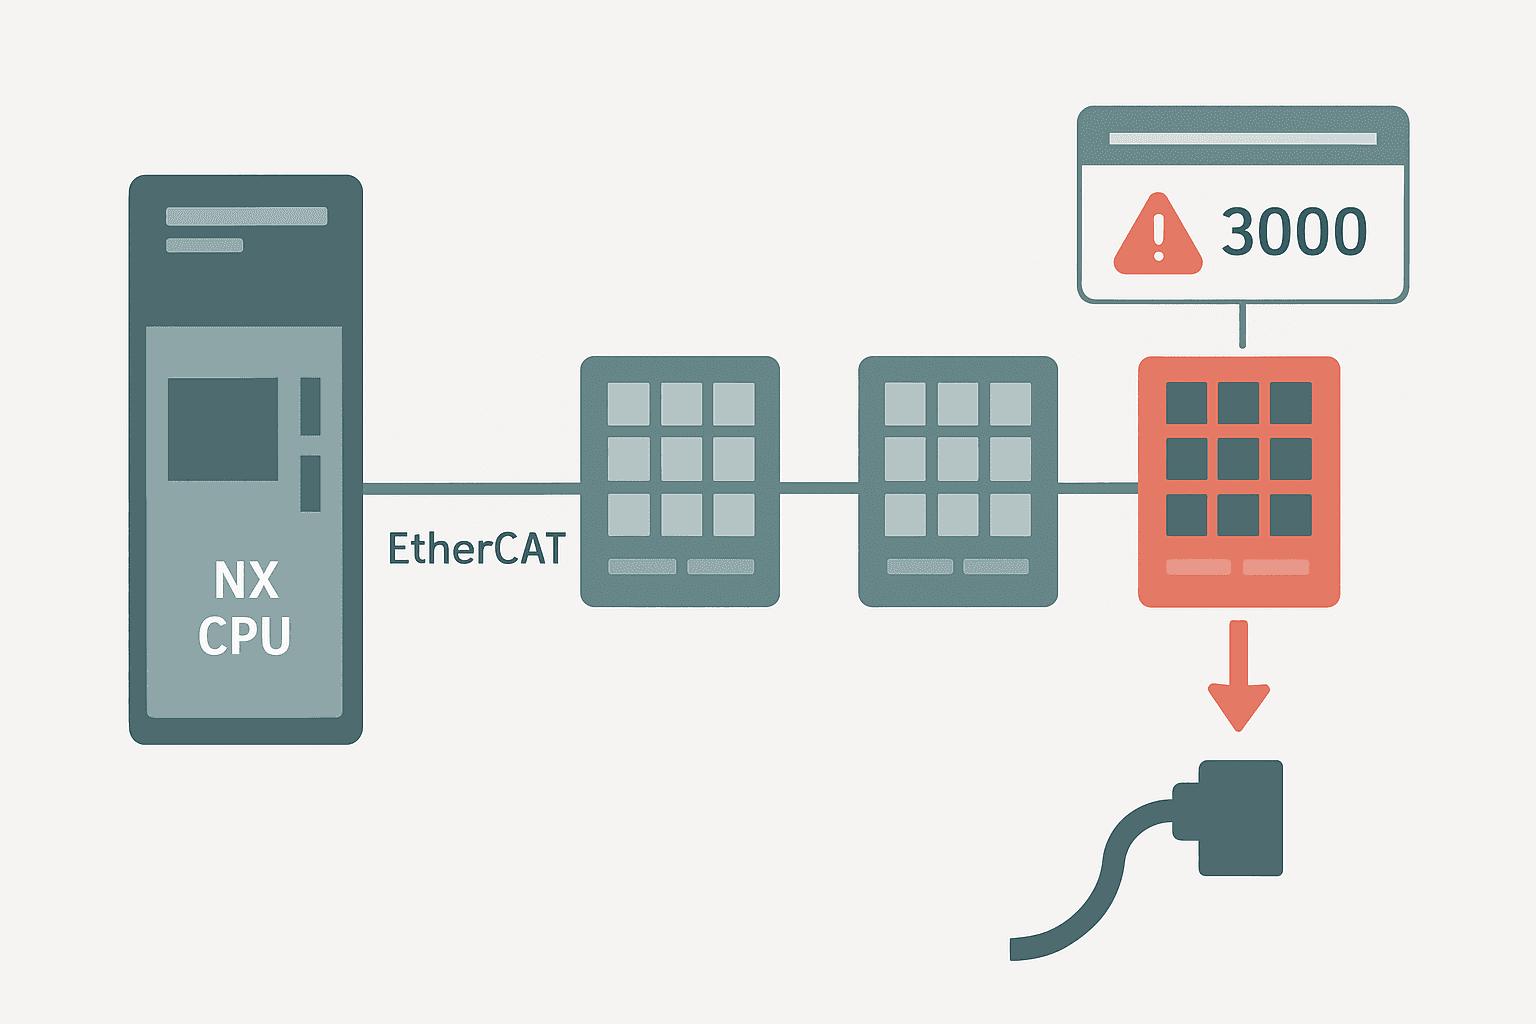
| 3000 hex | NX/NJ | I/O Refreshing Error | NX I/O unit not responding on EtherCAT | Check EtherCAT cable and unit power LED, re-scan |
| 0C00 hex (CJ) | CJ/CS | Unit Verification Error | Module type in project does not match physical unit | Match project I/O table to actual hardware, transfer |
| F003 hex | NX/NJ | Controller Backup Error | SD card missing or corrupt during backup | Insert valid SD card or disable auto-backup in settings |
EtherCAT and EtherNet/IP Fault Codes on NX Systems
NX-series hardware uses EtherCAT to communicate between the CPU and the I/O slices. When a slice loses communication you get a Partial Fault in the 3000 hex range. The source column in the Event Log identifies the specific NX unit. Nine times out of ten on a new installation the cable between slices is just not clicked in fully. The NX connectors need a firm push until you hear a click; they look seated before they actually are.
For EtherNet/IP connections to drives or remote I/O, Sysmac Studio shows Tag Data Link errors in the event log alongside the CIP connection status. If you are also working with EtherNet/IP on the broader network, the article on EtherNet/IP scanner vs adapter architecture explains why the NJ acts as the scanner and what happens when a target device goes offline.
Omron PLC Error Codes Triggered by I/O Wiring Problems
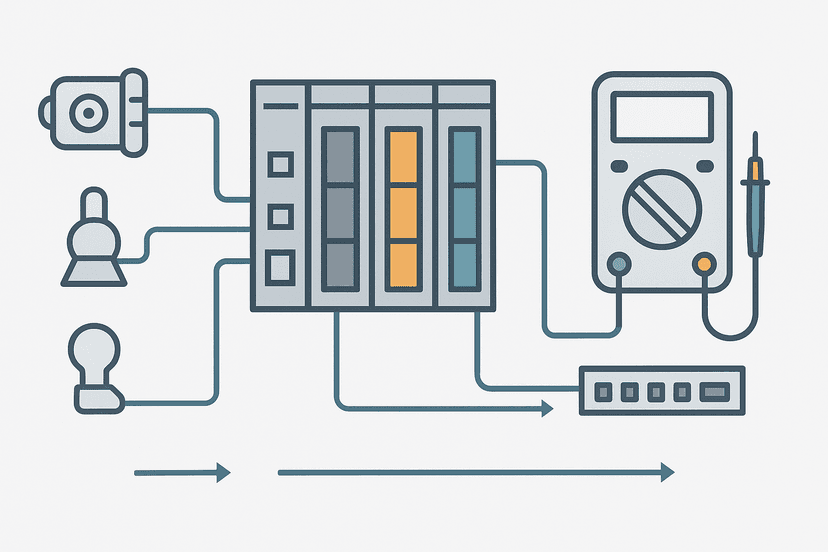
A significant number of fault calls I have attended turned out to be wiring issues presenting as module faults. An analog input module showing a channel error almost always means an open loop on a 4-20 mA input, not a failed module. The module is doing its job: it detected a wire-off or a transmitter failure and flagged it. Check the sensor wiring first before condemning the module. The guide on PLC I/O fault diagnosis with a multimeter walks through the exact measurement sequence.
PNP versus NPN wiring mismatches also generate input faults on CP and CJ modules. If you recently changed a sensor and now have an input channel error, check that the new sensor's output polarity matches the module's input type. The 3-wire sensor wiring guide covers exactly this scenario, and the sinking vs sourcing I/O explanation shows why polarity matters at the module level.
User-Defined Error Codes in Omron Programs
On NX/NJ controllers you can generate your own fault entries using the SetControllerError system function block. You assign a user event code between 0400 hex and 03FF hex, a severity level, and a description string. These appear in the standard Event Log just like hardware faults, which means your machine-specific faults are searchable and timestamped alongside system faults. This is far better than toggling a generic alarm bit and trying to correlate it to an HMI message table.
On CJ-series, the equivalent is the FALS instruction (fatal user-defined error) and FAL instruction (non-fatal). FALS takes a user code from 01 to 99 and a message string. When it executes, the CPU logs the error and, if it is a fatal FALS, halts program execution. You will see it in CX-Programmer's Error Log with prefix 4D (for FAL) or CF (for FALS) depending on the series.
A Repeatable Fault-Response Process
Having a process matters more than memorizing code numbers. Every Omron fault I have chased faster than average came down to this sequence:
- Note the LED state before you touch anything. Major fault or minor fault changes the urgency and the approach.
- Connect and open the Event Log. Screenshot or photograph it before clearing anything.
- Read the full detail for the highest-severity active event: description, cause, correction.
- Check the Source field. Is it a CPU internal fault, a specific I/O unit, or a network device?
- Go physical: inspect the identified hardware, check power, check LEDs on the suspect module.
- For program execution errors, use the software link to jump to the faulting code line.
- Fix the root cause. Do not skip this step.
- Clear the active errors, cycle power if required, and verify the fault does not return.
- Document what you found and what you changed. Future you will be grateful.
This process pairs well with online monitoring in Sysmac Studio, where you can watch variable values change in real time while the program runs after clearing the fault.
When Error Codes Point to CPU Faults
If the Event Log shows errors in the 1000 to 1FFF hex range on NX/NJ (CPU internal faults), or you see an FALS 9F on a CJ (watchdog timeout), you are looking at a CPU-level problem. These are less common than I/O or wiring faults but more serious. The detailed process for these is covered in the PLC CPU fault diagnosis guide, which applies equally to Omron and other platforms. The short version: try a memory clear and re-transfer of the project before assuming the CPU hardware has failed, because corrupted project data causes CPU errors far more often than actual CPU hardware death.
Also check the PLC scan cycle troubleshooting guide if your Omron CPU is logging task period exceeded errors. NX/NJ controllers log these as an Observation or Minor Fault when a primary periodic task overruns its period, and heavy motion or communication code is usually the culprit.
Sending Omron Fault Data to HMI and SCADA
On NX/NJ systems, the system variable _ControllerStatus.Error goes TRUE when any active fault exists. _ControllerStatus.ErrorCode holds the most recent event code as a WORD. Map these to your HMI tags for a basic fault indicator. For richer data, use the GetControllerError function block to pull the full active event list into an array you can display on screen.
If your plant runs SCADA, OPC UA is the cleanest path: the NX/NJ built-in OPC UA server exposes these system variables without any extra configuration. The OPC UA protocol guide for PLC engineers explains how to browse and map the address space. For HMI alarm configuration once the fault bits are mapped, the HMI alarm configuration article covers how to turn a raw fault bit into a useful, actionable alarm message.
Keep Learning
Now that you can read and clear Omron error codes, the next step is building a faster overall troubleshooting workflow. Start with PLC troubleshooting using online monitoring to learn how to watch logic execute live while chasing intermittent faults. If your fault points to a wiring or I/O issue, PLC I/O fault diagnosis with a multimeter gives you the measurement steps. And for a deeper look at the Sysmac Studio environment itself, the Omron Sysmac Studio getting-started guide covers project structure, online connection options, and the tools you will use every day.
Frequently asked questions
What does a major fault mean on an Omron NX or NJ PLC?
How do I clear an Omron PLC error code in Sysmac Studio?
What is error code 8400 on an Omron NJ controller?
How do I read Omron CP-series error codes without a laptop?
What is the difference between an A-level and B-level error on Omron PLCs?
Why does my Omron PLC show error A401?
Can Omron NX error codes be sent to an HMI or SCADA system?
What causes a FINS communication error on an Omron PLC?
How do I find which I/O module is causing a unit error on a CJ2 system?
Learn this by building it
There is a PLC in this site. It runs a real scan engine, checks your logic against the same tests a working machine would fail, and needs no download and no account.
Open the exercisesFree, no signup, runs in your browser. See all 16 exercises.
Was this helpful?