Siemens PLC Error Codes: How to Read and Fix Them
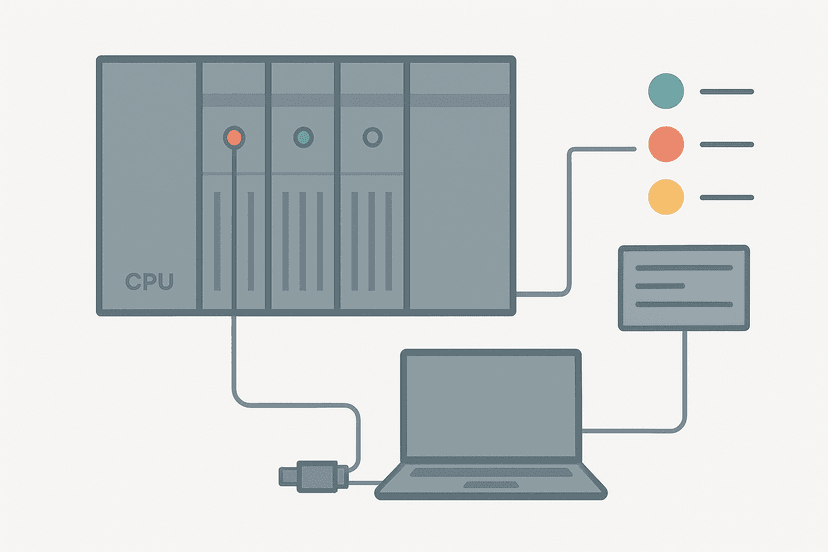
A Siemens CPU sitting in STOP with a red LED is telling you something specific. The mistake most technicians make is reaching for the mode switch before reading the diagnostic buffer. The buffer already knows what happened, when it happened, and which organization block the CPU was trying to call. Skip that step and you are guessing.
What Are Siemens PLC Error Codes?
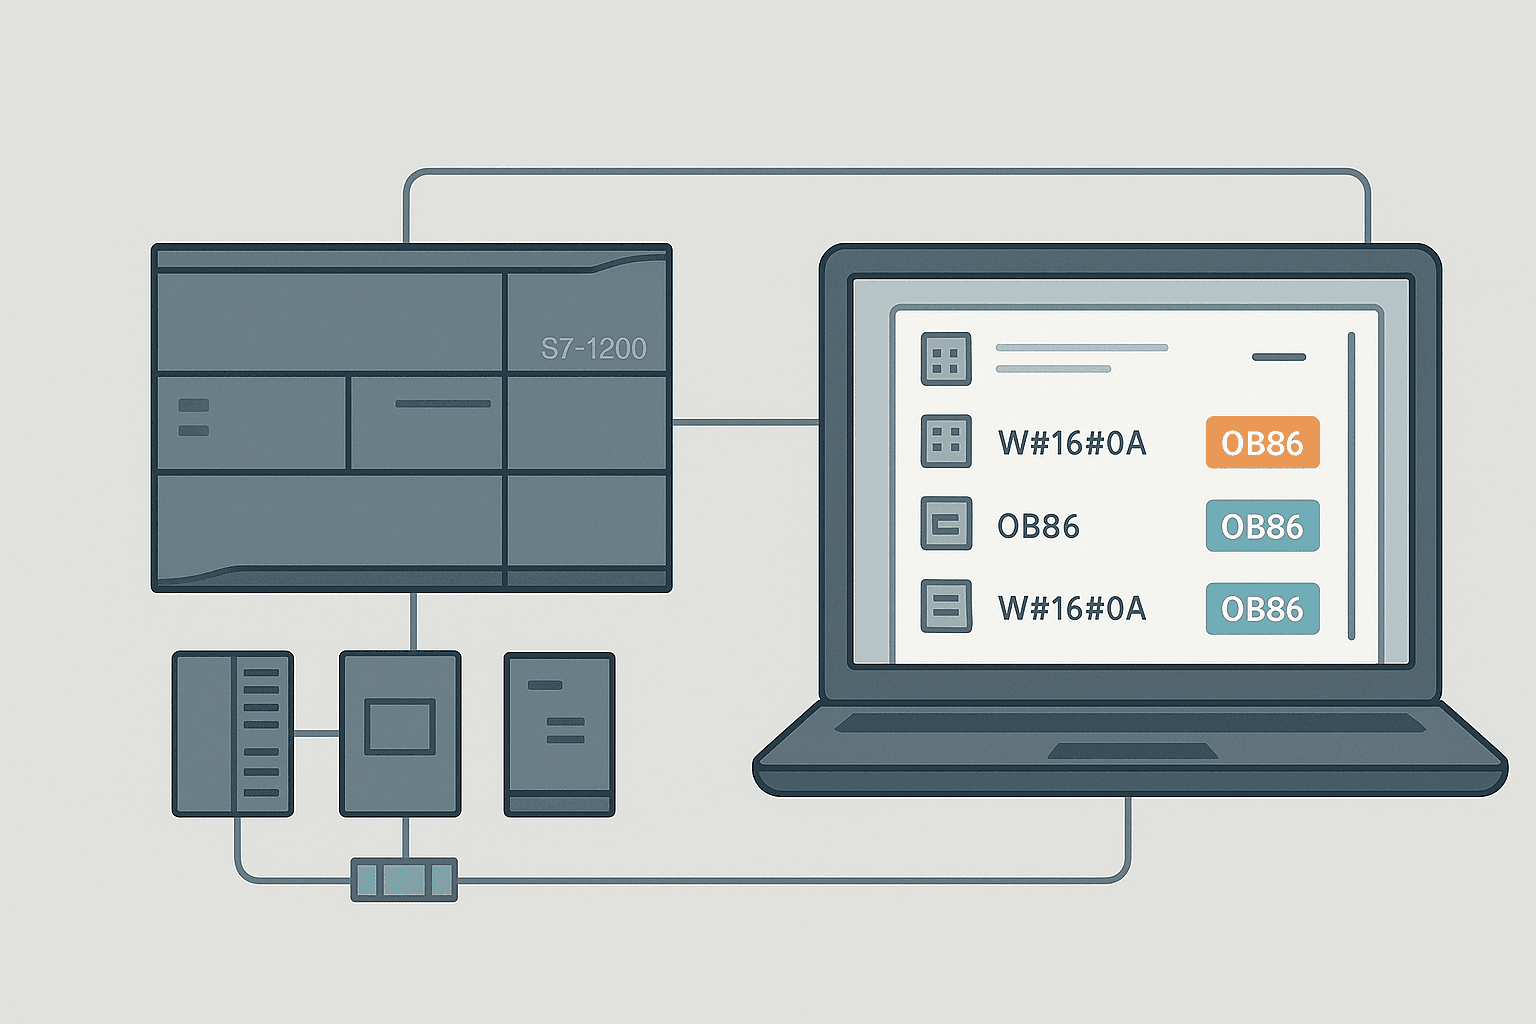
Siemens PLC error codes are structured event IDs stored in the CPU's diagnostic buffer every time a fault, mode change, or system event occurs. Each entry carries a hexadecimal event ID (written in the W#16# format), a plain-text description, a timestamp, and a reference to the organization block (OB) the CPU attempted to call in response. On S7-1200 and S7-300/400 platforms, these codes are your primary first-response tool when a machine stops unexpectedly.
How to Open the Diagnostic Buffer in TIA Portal
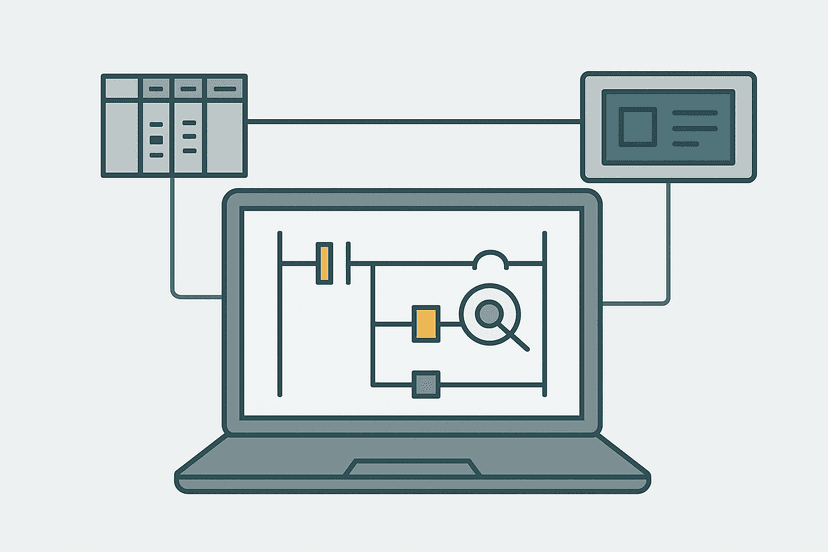
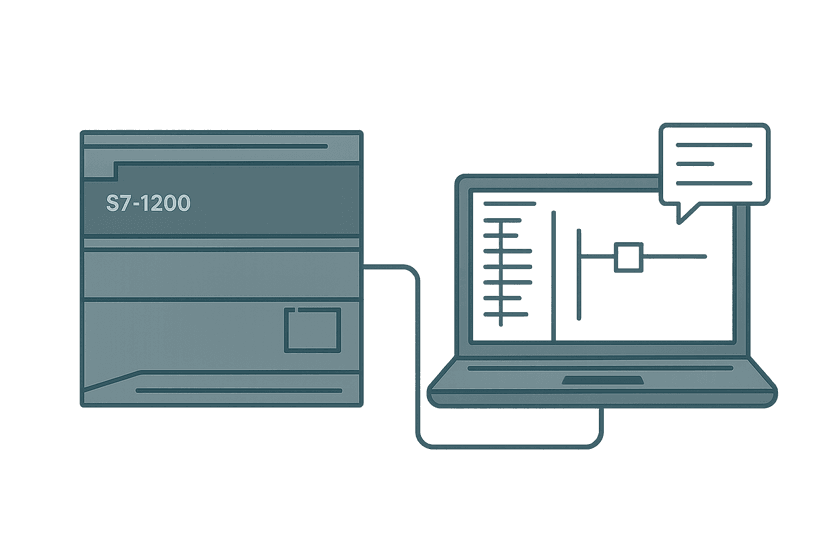
Go online to your CPU in TIA Portal. In the project tree, right-click the CPU and choose 'Online and diagnostics'. The panel that opens has a 'Diagnostics' section in the left-hand menu. Click 'Diagnostic buffer' and the entries load in reverse-chronological order, newest at the top. Each line shows the event ID, the event class, the local time, and a one-line description in plain English (or your TIA Portal language setting).
Click any entry to expand it. You will see the full event text, the OB number that was called, the OB priority, and sometimes the DB or memory address involved. That expanded view is where most faults become obvious. If you have been using PLC troubleshooting with online monitoring as your main technique, the diagnostic buffer is a natural complement: online monitoring shows you the current state; the buffer shows you what changed and when.
The OB System: Why a Missing Block Stops the CPU
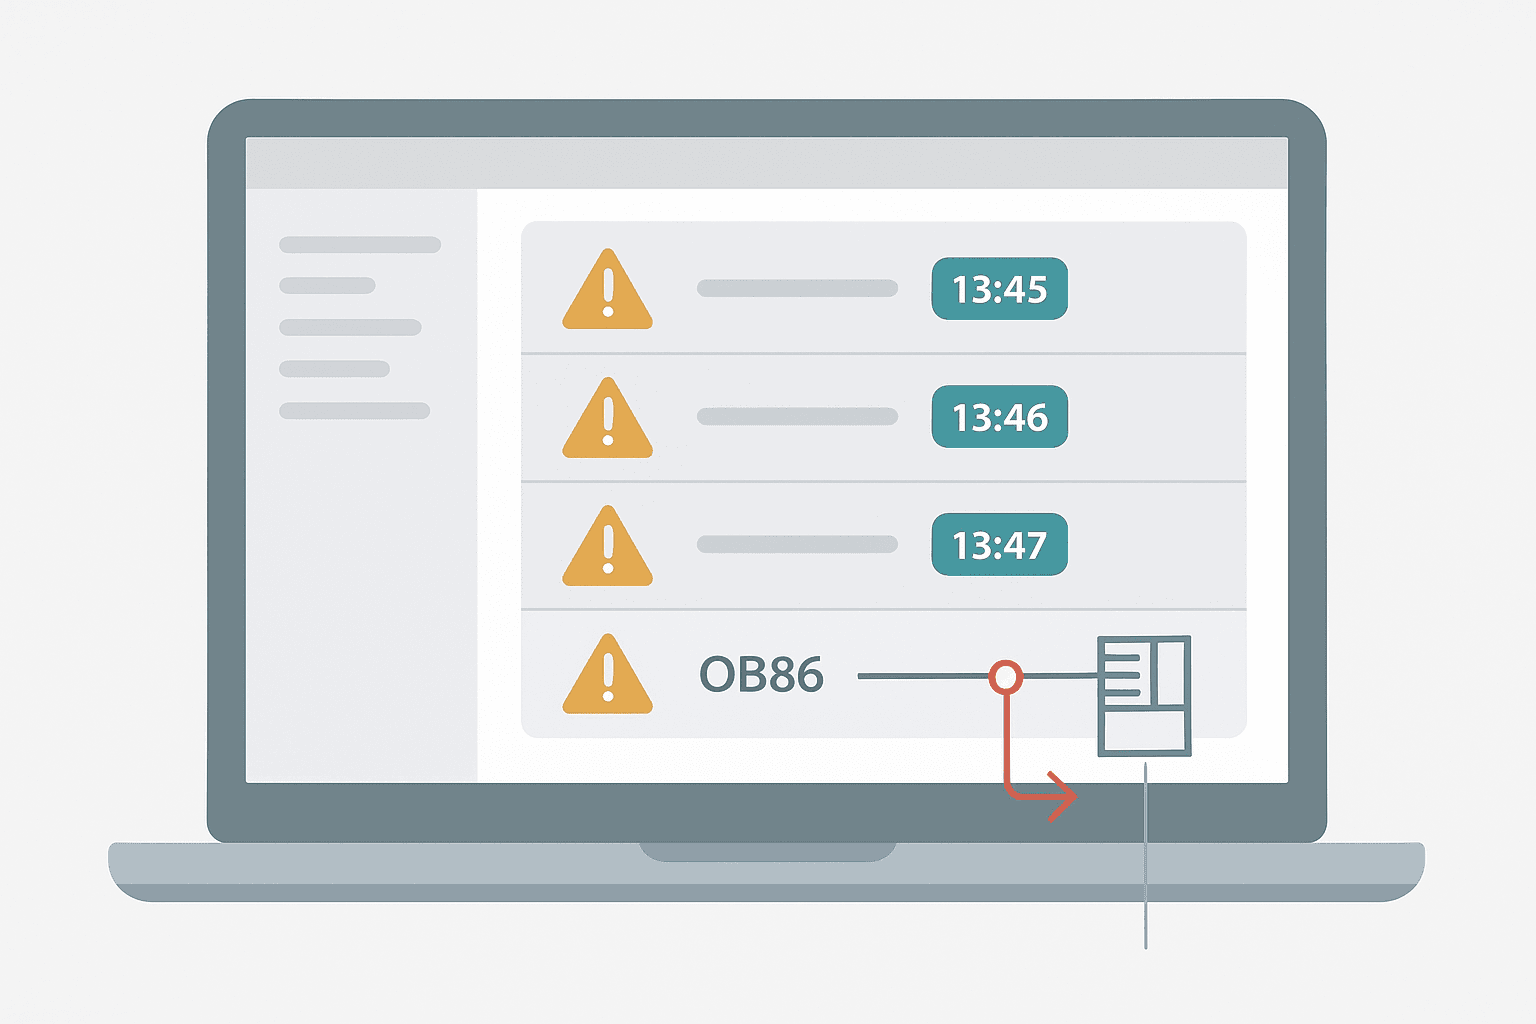
Siemens S7 CPUs respond to fault events by calling a specific organization block. If that OB exists in your project, the CPU executes it and keeps running. If the OB is absent, the CPU goes to STOP and logs the event. This is the single most common reason a Siemens CPU faults during commissioning: a distributed I/O device drops off the PROFINET network, the CPU tries to call OB86, finds nothing there, and stops.
The fix is straightforward: add the OB to your project. You do not have to put any code in it. An empty OB tells the CPU 'I know about this event type; keep running.' You can then add your own fault-handling logic inside the OB later. When you are troubleshooting a PROFINET communication loss, always check for OB86 first.
| OB Number | Event That Triggers It | What Happens Without It |
|---|---|---|
| OB80 | Cycle time exceeded (watchdog overrun) | CPU goes to STOP |
| OB82 | Diagnostic interrupt from a module | CPU goes to STOP |
| OB85 | I/O access error (module not responding) | CPU goes to STOP |
| OB86 | PROFINET device or DP slave offline | CPU goes to STOP |
| OB121 | Programming error (e.g. wrong data type) | CPU goes to STOP |
| OB122 | I/O peripheral access error (direct I/O) | CPU goes to STOP |
Most Common Siemens PLC Error Codes and Their Fixes
OB86 / W#16#38C2: Rack or Station Failure
This is the most frequent fault on any PROFINET or PROFIBUS installation. A remote I/O head station, a drive, or an ET 200SP module has stopped communicating. The diagnostic buffer entry tells you the device address (PROFINET device name or DP address) so you know exactly which piece of hardware to inspect. Check the LINK LEDs on the device, verify cable integrity, and confirm the device's IP address matches the TIA Portal configuration. The PROFINET wiring guide covers cable and connector failure modes in detail.
OB85 / W#16#0A29: I/O Access Error
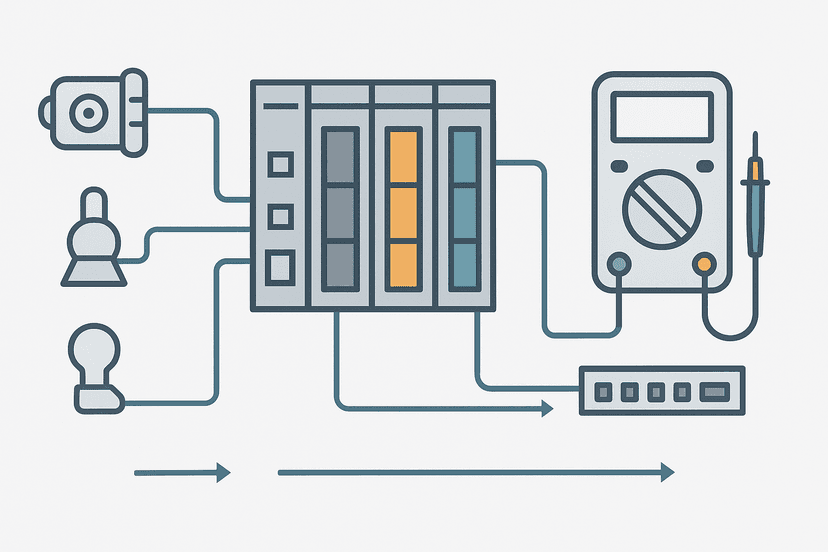
The CPU tried to read or write an I/O address that does not correspond to a responding module. This happens when a module is physically missing from a rack slot, when a module has failed, or when the hardware configuration in TIA Portal does not match what is actually installed. Open the device view in TIA Portal online and look for modules shown in red or with a warning triangle. A multimeter check at the module terminals will confirm whether the module is getting 24 VDC backplane power.
OB80 / W#16#0501: Cycle Time Overrun
The scan cycle took longer than the configured maximum cycle time. On an S7-1200 the default watchdog is 150 ms; on an S7-300 it is also configurable but defaults to 150 ms. Common causes: a large communication load on OB1, a FOR loop iterating over a very large array, or a slow PROFINET device holding up the I/O update. Check the cycle time under 'Online and diagnostics > Cycle time'. If the peak cycle time is regularly above 80% of the watchdog limit, you need to either increase the watchdog value in the CPU properties or optimize the code. PLC scan cycle problems covers this in depth.
OB121 / W#16#2521: Programming Error
A block called a function with the wrong data type, accessed an array index out of bounds, or referenced a DB that does not exist. The diagnostic buffer entry for OB121 includes the block number and the network number where the error occurred. Go directly to that block and network, fix the type mismatch or bounds issue, and redownload. This one bites most often after a partial code update where a DB was renumbered but the calling FC was not updated.
OB82 / W#16#0388: Module Diagnostic Interrupt
A signal module detected an internal fault: a blown fuse on an output channel, a short circuit on a transistor output, or an open-wire detection trip on a configured analog channel. The buffer entry identifies the module's slot address. In TIA Portal online, expand the device view and click the flagged module to see its channel-level diagnostics. For analog modules, an open-wire fault almost always means the 4-20 mA loop has lost continuity somewhere between the transmitter and the module terminal.
Reading Error Codes on S7-300 and S7-400 in STEP 7 Classic
If you are on an older S7-300 or S7-400 site still running STEP 7 (not TIA Portal), the diagnostic buffer is under PLC > Module Information > Diagnostic Buffer. The layout is the same: event ID, description, time, OB. One difference worth knowing: the S7-300 buffer holds up to 100 entries versus the S7-1200's 50. The event IDs use the same W#16# format, and the OB logic is identical. Some older sites have neither TIA Portal nor STEP 7 available on the shop floor. In that case, a Siemens OP or TP HMI panel connected via MPI can display the diagnostic buffer through the system diagnostics screen, which is built into every WinCC Flexible and WinCC Comfort panel.
Using SFB 54 (RALRM) to Read Faults in Your Own Code
For systems where the SCADA or HMI needs to display fault details without an engineer going online, you can read the diagnostic buffer programmatically. On S7-300/400, SFB 54 RALRM reads interrupt alarm data from a module into a data structure your program can parse. On S7-1200 and S7-1500, the equivalent is the 'GetAlarm' and 'GetDiagnostics' system functions available in the instruction library. The output includes the event class, the channel address, and the error code, which you can then map to HMI text. This is exactly how mature HMI alarm configurations on Siemens sites surface module-level faults as readable operator messages rather than raw hex codes.
A Systematic Approach to Any Siemens CPU Fault
- Go online in TIA Portal (or STEP 7) before touching anything.
- Open the diagnostic buffer and read the top 3 to 5 entries. Note the OB number and event ID.
- Expand the most recent STOP event to get the module slot address or device name.
- Check the physical hardware at that address: LEDs, terminal voltages, cable connections.
- Verify the TIA Portal hardware configuration matches the actual installed hardware.
- Add the missing OB if the CPU stopped because the OB was absent, then fix the root cause.
- Fix the root cause, not just the symptom. If a PROFINET device dropped off, find out why before restarting.
- Switch the CPU to RUN and monitor the cycle time and buffer for 5 minutes before leaving.
One commissioning job that stuck with me was an S7-400 running a palletizer that would fault randomly, once or twice a shift. The operators would restart it, it would run fine for hours, then fault again. The diagnostic buffer showed OB85 every time, always pointing to the same ET 200M rack slot. The module was fine electrically. Turned out the backplane connector on that rack had a hairline crack that opened under thermal expansion as the panel warmed up. Swapping the backplane connector fixed it permanently. The buffer entry gave us the slot number every single time; without it, we would have been chasing ghosts for days. That kind of systematic reading of CPU faults is what separates a fast resolution from a long one.
S7-1200 Specific: LED Status Codes at a Glance
| LED State | Meaning | First Check |
|---|---|---|
| RUN/STOP solid green | CPU running normally | None needed |
| RUN/STOP solid yellow | CPU in STOP mode | Read diagnostic buffer |
| RUN/STOP flashing yellow | CPU in STARTUP mode | Wait; check buffer if it stays |
| ERROR flashing red | Hardware or firmware error | Buffer then memory card |
| MAINT flashing yellow | Maintenance required (e.g. forced I/O active) | Check forced tags in TIA Portal |
If you are also seeing faults on variable-frequency drives connected to the same machine, remember that drive faults and PLC faults are independent event logs. A VFD fault code will not appear in the PLC diagnostic buffer unless you have programmed the drive's fault word into the PLC via a communication link and are logging it yourself. Check both logs separately when diagnosing a machine stop.
What to Read Next
The diagnostic buffer gets you to the fault fast. From there, the actual repair often involves checking I/O signals at the terminals, verifying network device status, or tracing logic in online monitoring. These three posts cover each of those next steps in detail: PLC I/O Fault Diagnosis with a Multimeter, PROFINET Communication Loss: How to Diagnose It, and PLC Troubleshooting with Online Monitoring. If you want to go deeper on what the S7-1200 can do before you need to troubleshoot it, S7-1200 First Program in TIA Portal is a solid starting point.
Frequently asked questions
Where do I find Siemens PLC error codes in TIA Portal?
What does a Siemens W#16# error code mean?
What is OB86 on a Siemens S7 PLC?
Why does my Siemens S7-1200 go to STOP with no obvious fault?
What is the difference between OB80 and OB85 in Siemens?
How do I clear a Siemens PLC fault and restart the CPU?
Can I read Siemens PLC error codes without TIA Portal?
What causes a Siemens S7-1200 to show a BUSF LED?
How long does the Siemens diagnostic buffer keep its entries?
Learn this by building it
There is a PLC in this site. It runs a real scan engine, checks your logic against the same tests a working machine would fail, and needs no download and no account.
Open the exercisesFree, no signup, runs in your browser. See all 16 exercises.
Was this helpful?