S7-1200 Diagnostic Buffer: Read Fault Codes Fast
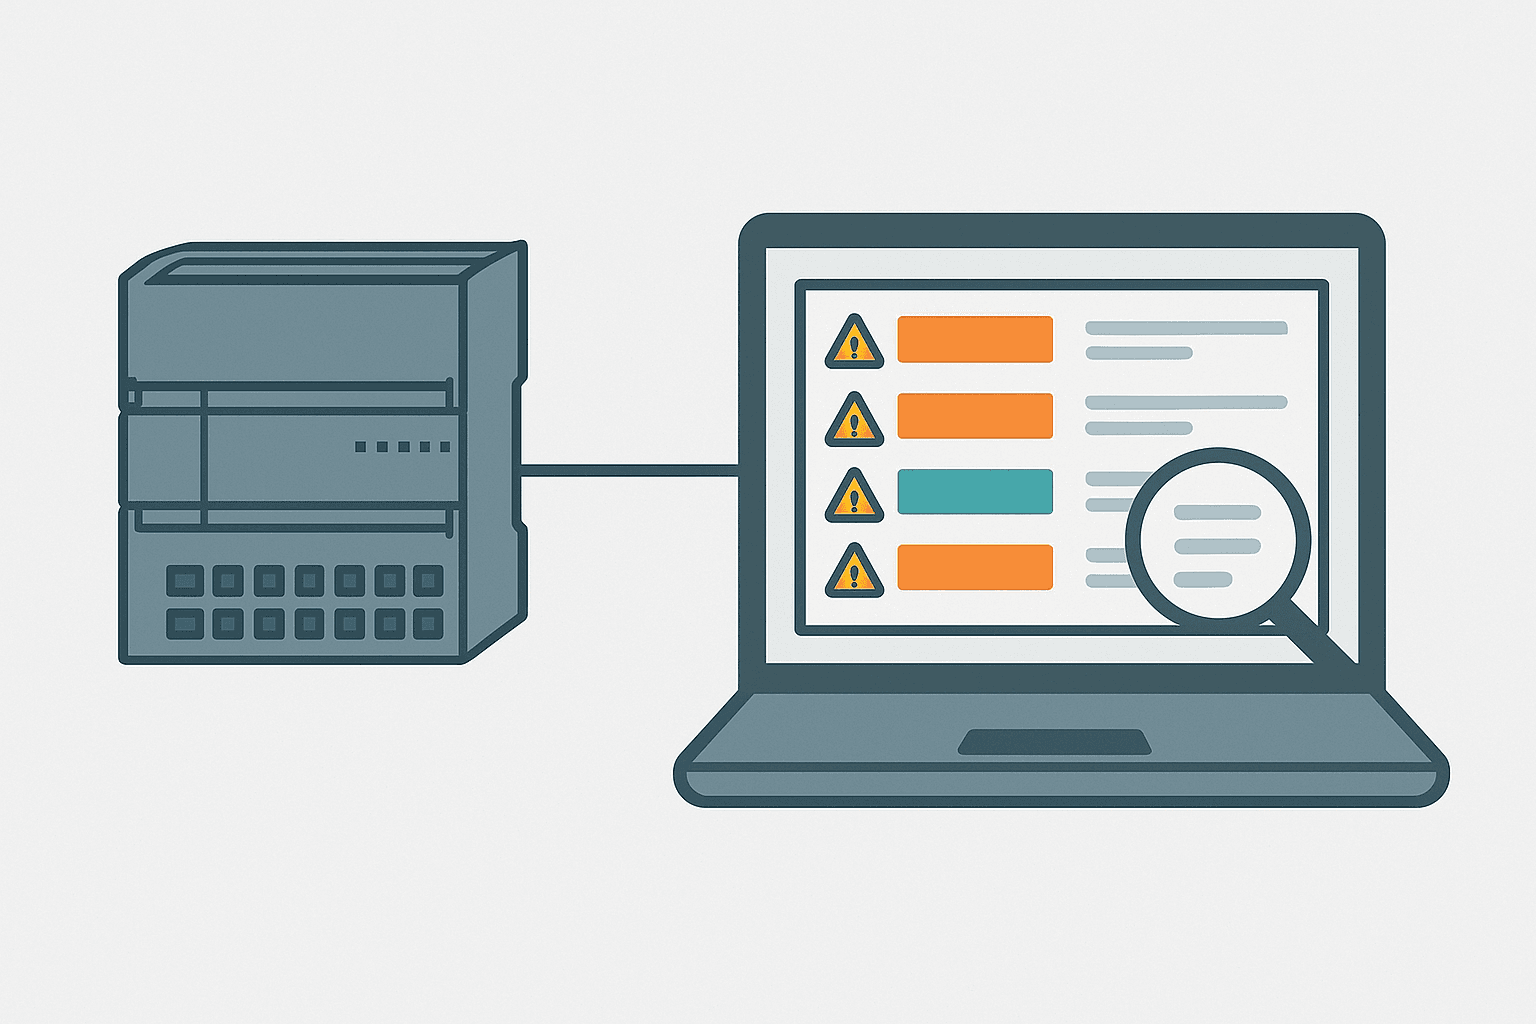
Your S7-1200 is sitting in STOP with the red LED on, the line is down, and nobody wrote anything in the maintenance log. The diagnostic buffer has the answer. Every fault, every transition from RUN to STOP, every I/O module removal: the CPU logs it, timestamps it, and keeps it waiting for you. Knowing how to read that buffer quickly is one of the highest-value skills a Siemens engineer can have.
What Is the S7-1200 Diagnostic Buffer?
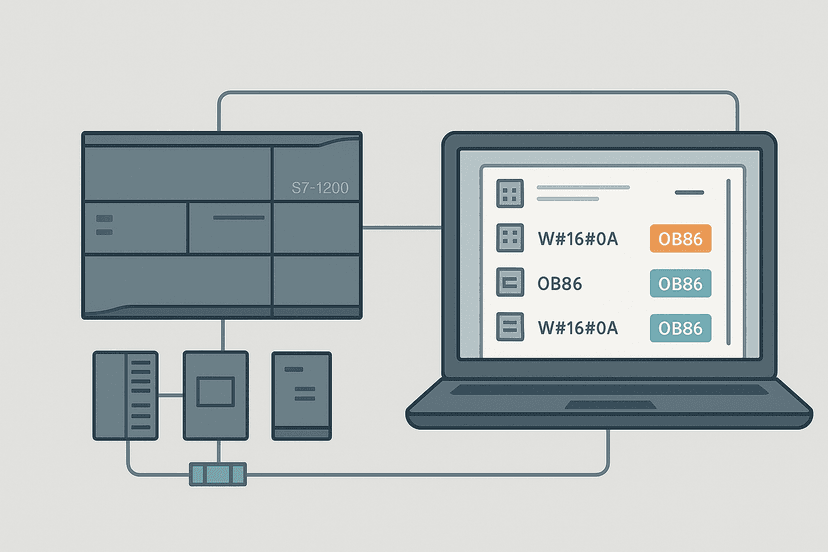
The S7-1200 diagnostic buffer is a fixed-size, circular log inside the CPU's retentive memory that records up to 50 system events in reverse chronological order. Each entry includes a timestamp, an event class, a plain-language description, and a hexadecimal event ID. The buffer survives power loss, cannot be overwritten by user logic, and is accessible through TIA Portal's Online and Diagnostics view. It is the first place you should look whenever the CPU leaves RUN mode unexpectedly.
How to Open the Diagnostic Buffer in TIA Portal
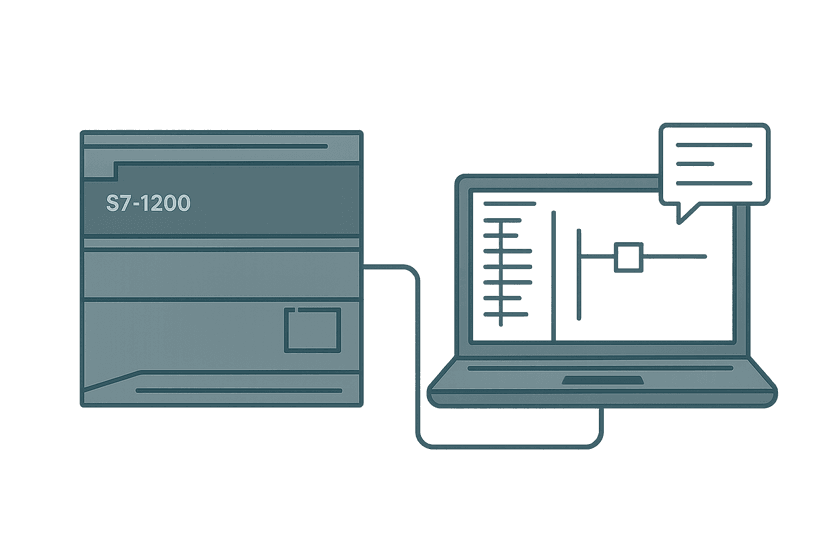
The steps are straightforward once you know where to look. TIA Portal buries the view slightly, so here is the exact path:
- Connect your PC to the CPU via Ethernet (or the built-in PROFINET port) and click the Go online button in TIA Portal's toolbar. The CPU icon in the project tree turns orange or green depending on state.
- In the project tree, right-click the CPU (e.g. PLC_1 [CPU 1214C DC/DC/DC]) and select Online and Diagnostics. A new editor tab opens.
- In the left-hand navigation tree of that tab, expand Diagnostics and click Diagnostic buffer. The event list appears on the right.
- Click any entry to see the full description at the bottom of the pane, including the OB number, network ID and any associated data record.
- To save the buffer before a memory reset, click the Save diagnostic buffer icon (floppy disk) in the toolbar. TIA Portal exports it as a .txt file.
Reading Siemens Fault Codes: What Each Field Means
Each diagnostic buffer entry has five key fields. Once you understand them, you can decode almost any fault without opening the manual.
| Field | What It Contains | Example |
|---|---|---|
| No. | Entry number, 1 = newest | 1 |
| Date / Time | CPU clock timestamp to millisecond resolution | 2024-03-14 07:23:41.482 |
| Event | Plain-language description from firmware | Programming error causing STOP |
| Event ID | Hex code for the event class | 16#EA01 |
| Details | OB, network, instruction that triggered the event | OB1, Network 4, DIV instruction |
The event ID is the most useful field for pattern recognition. Siemens groups IDs by the upper nibble: IDs starting with 16#4x are informational (module inserted, IP address assigned), 16#6x are warnings, and 16#Ex are errors that cause a CPU STOP. You do not need to memorise them all. TIA Portal always provides the text description, and the Siemens PLC error codes guide on this site covers the most common IDs in detail.
The Most Common S7-1200 Fault Codes You Will Actually See
In four years of commissioning S7-1200 panels across food and water-treatment sites, the same handful of event IDs appeared over and over:
| Event ID | Description | Typical Root Cause |
|---|---|---|
| 16#EA01 | Programming error: CPU goes to STOP | Array out-of-bounds access, divide-by-zero, wrong DB type |
| 16#E201 | I/O access error | Wired I/O module missing or failed; address gap in hardware config |
| 16#4521 | Module removed or failed | Signal module unplugged, SB loose, or 24 V supply lost to module |
| 16#6580 | Time-of-day interrupt skipped | Scan cycle overload; OB10 or OB35 could not execute in time |
| 16#EA10 | Nesting depth exceeded | Too many nested FC/FB calls; check call stack depth |
| 16#4920 | PROFINET device fault | Device went offline; see also the PROFINET comm loss workflow |
The 16#EA01 programming error is the one that catches engineers the most during commissioning. It almost always points to a specific network in a specific OB, and TIA Portal tells you exactly which one. Go online, read the buffer entry details, note the OB and network number, open that rung, and you will see the problem immediately. I once spent 45 minutes hunting a random CPU stop on a bottling line before realising the buffer had been showing 16#EA01, OB1, Network 12 the whole time. The divide instruction had a tag whose initial value was zero on first scan.
LED Status Codes: Reading the Front Panel Before You Open TIA Portal
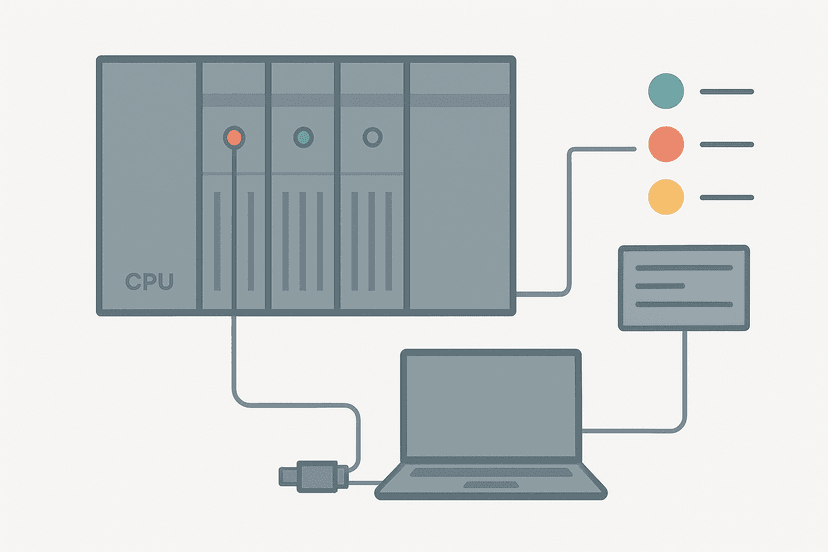
Sometimes you are standing in front of the panel without a laptop. The S7-1200 front LEDs give you a head start on diagnosis. The CPU has three LEDs: RUN/STOP (green/yellow), ERROR (red) and MAINT (yellow). Here is what the combinations mean:
- Solid green RUN: CPU is in RUN mode, no faults.
- Solid yellow STOP: CPU halted by command or fault. Connect TIA Portal and read the buffer.
- Slow flashing yellow STOP (0.5 Hz): CPU waiting for memory reset (MRES).
- Fast flashing yellow STOP (2 Hz): Memory reset in progress.
- Flashing red ERROR + solid yellow STOP: Hardware or firmware fault. Check buffer immediately.
- Flashing yellow MAINT: Maintenance request active, often from an IO-Link device or a PROFINET device with a maintenance event.
- All three LEDs flashing together: Firmware update in progress. Do not power off.
If you see a flashing red ERROR LED, that is a hard stop. The PLC CPU faults step-by-step guide covers the full diagnosis workflow including hardware faults that the diagnostic buffer alone cannot resolve, such as a failed CPU module itself.
How to Clear Faults and Return the CPU to RUN
There are three ways to restart an S7-1200 after a fault. Choose based on what the fault was:
- TIA Portal Online and Diagnostics, CPU Operator Panel: Click the virtual RUN button. Quickest method when you are already online. If the fault is cleared but the cause was not fixed, the CPU will stop again.
- Physical MODE button: Hold the button on the CPU face for 3 seconds while in STOP. The RUN LED will flash then go solid green. This works without a laptop and is the go-to method for operators who have been trained on it.
- Memory reset (MRES): Use only when you need to reload from scratch. Hold the MODE button until the STOP LED flashes three times, release, then press again within three seconds. This clears all retentive data, the diagnostic buffer, and all user data. Use sparingly: you will lose everything including retain tags and the fault history you may need for root cause analysis.
Using the Diagnostic Buffer Alongside Other TIA Portal Tools
The diagnostic buffer tells you what and when. Other tools tell you why. Use them together:
- Online monitoring (Watch Tables): After identifying the faulty network from the buffer, open a Watch Table with the relevant tags to see live values. The PLC troubleshooting with online monitoring guide walks through this in detail.
- Module information page: Check the I/O module status under Online and Diagnostics if the buffer shows a 16#E201 I/O access error. The module page will confirm which slot is faulty.
- Cross-reference tool (Ctrl+Shift+F in TIA Portal): Once you know the tag or DB that caused the 16#EA01, use cross-reference to find every place it is used in the program.
- System diagnostics OB (OB82): If you have OB82 in your project, it executes whenever an I/O module changes state. Add a simple counter or flag inside OB82 to capture the exact module address at the moment of the fault.
For PROFINET-related entries in the buffer, the PROFINET communication loss diagnosis guide is the logical next stop. A 16#4920 entry in the buffer is just the start of that investigation.
Practical Workflow: From CPU STOP to Running in Under 10 Minutes
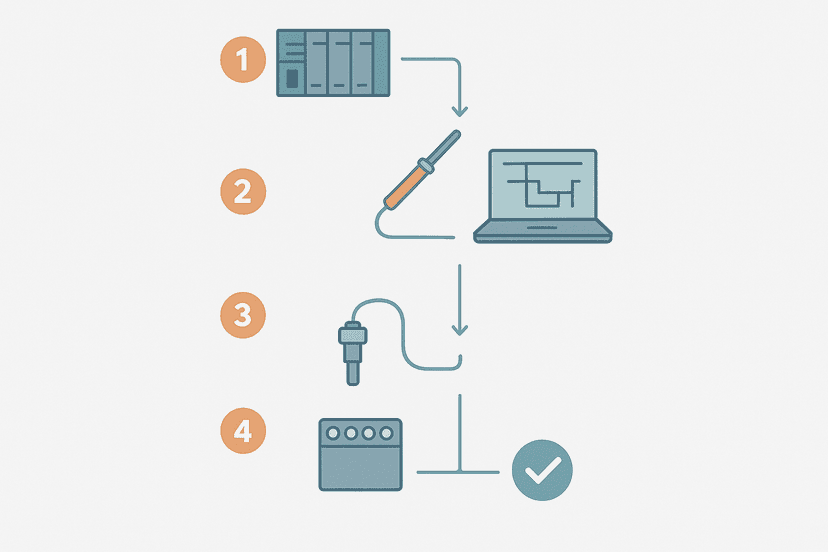
Here is the exact sequence I follow when I arrive at a stopped S7-1200:
- Read the front LEDs before touching anything. Solid STOP or flashing ERROR gives you the first clue.
- Connect TIA Portal, go online, open Online and Diagnostics, open the Diagnostic buffer.
- Read entry No. 1 (the newest). Note the event ID and the description.
- If it is a 16#EA01, click the entry and read the OB and network number from the details pane. Go to that network in the program editor.
- If it is a 16#E201 or 16#4521, go to the Module Information page and check which slot is flagged. Verify 24 V supply to that module with a multimeter. The PLC I/O fault diagnosis with a multimeter guide covers voltage checks step by step.
- Fix the root cause. Do not skip this step.
- Save the diagnostic buffer if you need a record.
- Click RUN in the CPU Operator Panel or press the MODE button. Confirm the green RUN LED and verify the process is running correctly.
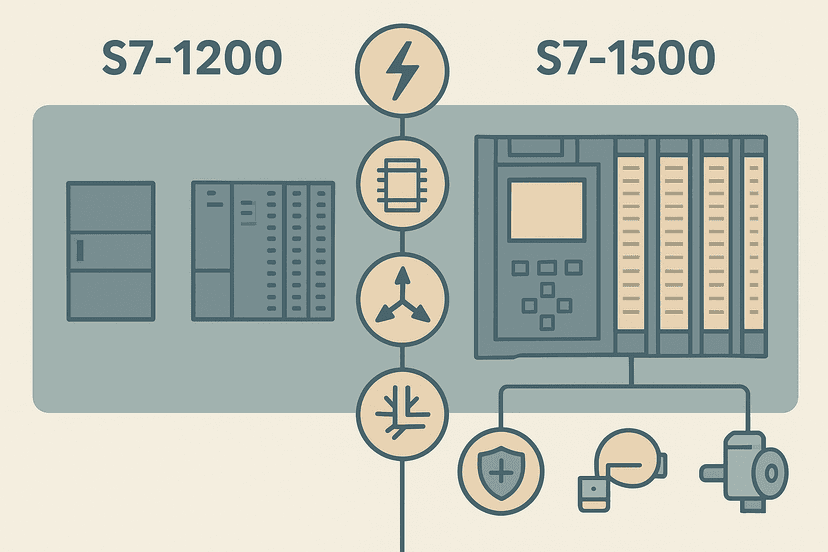
This workflow applies equally to the S7-1500 family. If you are deciding which CPU to use on your next project, the S7-1200 vs S7-1500 comparison covers the diagnostic capability differences between the two, including the extended diagnostic buffer size on the 1500 series.
Diagnostic Buffer Access from the Built-In Web Server
If TIA Portal is not available, the S7-1200 built-in web server lets you read the diagnostic buffer from any browser on the same network. Enable it in Project Properties, Web Server, tick Enable web server on all modules of this project, download the change, and navigate to http://192.168.0.1 (replace with your CPU's IP). Log in with your configured credentials and click Diagnostics. The buffer is right there, same events, same timestamps. This is genuinely useful for remote support: you can ask an operator to read the web page over the phone and tell you the event ID without needing TIA Portal on site.
You can take this further with OPC UA if you need automated fault logging to a SCADA historian. The OPC UA protocol guide for PLC engineers covers the S7-1200 server configuration. And if you want the buffer data surfaced on an HMI panel directly, the HMI programming in TIA Portal guide shows how to configure the built-in WinCC alarm system to display CPU diagnostic events automatically.
A Note on Data Block Faults and Retain Memory
A surprisingly common cause of 16#EA01 faults is incorrect use of data blocks, especially after a firmware update or a download that changes a DB interface. If a DB is downloaded with changed offsets but the retain values in the CPU still hold the old structure, you get a type mismatch at runtime. The TIA Portal DB Retain and Re-Initialization guide explains exactly how this happens and how to prevent it. Understanding S7-1200 data blocks: global vs instance also helps you structure your programs so DB-related faults are easier to trace in the buffer.
Keep Learning
The diagnostic buffer is your fastest path to a stopped CPU's root cause, but it works best when you combine it with a systematic fault-finding approach. The PLC fault finding: a systematic 6-step method gives you the broader framework to work through any PLC fault, not just Siemens stops. If you want to build confidence reading and writing S7-1200 programs before the next fault hits, the S7-1200 first program in TIA Portal guide is the logical starting point, and the Structured Text in TIA Portal practical guide covers the language where most 16#EA01 programming errors tend to hide.
Frequently asked questions
How do I open the diagnostic buffer on an S7-1200 in TIA Portal?
How many events does the S7-1200 diagnostic buffer store?
What does Event ID 16# mean in the S7-1200 diagnostic buffer?
How do I reset an S7-1200 CPU fault and get it back to RUN?
What does a flashing STOP LED mean on the S7-1200?
Can I read the S7-1200 diagnostic buffer without TIA Portal?
What is a STOP with event ID 16#EA01 on the S7-1200?
Does cycling power on the S7-1200 clear the diagnostic buffer?
How do I do a complete memory reset (MRES) on an S7-1200?
What is the difference between the diagnostic buffer and the module information page in TIA Portal?
Learn this by building it
There is a PLC in this site. It runs a real scan engine, checks your logic against the same tests a working machine would fail, and needs no download and no account.
Open the exercisesFree, no signup, runs in your browser. See all 16 exercises.
Was this helpful?